Understanding key financial ratios is essential for running a successful restaurant. These ratios act like vital signs for your business, giving you a clear snapshot of financial stability, operational efficiency, and long-term sustainability.
From monitoring food costs and labor expenses to measuring table turnover and profitability, these key performance indicators (KPIs) help restaurant owners make informed decisions. Rather than relying on guesswork, tracking the right ratios allows you to identify inefficiencies, control costs, and improve overall performance.
This guide breaks down the most important restaurant industry ratios, including profitability metrics, cost control ratios, operational efficiency indicators, and solvency benchmarks. By understanding and regularly monitoring these numbers, restaurant operators can maintain financial health and create sustainable growth.
Understanding Your Restaurant’s Financial Health
Restaurant financial ratios provide insights into how efficiently your business generates revenue, manages expenses, and maintains financial stability. By analyzing these numbers regularly, owners can quickly identify areas where profits are leaking or where opportunities for improvement exist.
For example, tracking food cost percentage reveals whether menu pricing and purchasing strategies are sustainable. Monitoring labor costs shows whether staffing levels match customer demand. Operational metrics like table turnover indicate whether your dining room is generating maximum revenue.
Restaurant operators who consistently monitor these KPIs can make smarter decisions about pricing, staffing, purchasing, and service strategy. Over time, these insights help turn a struggling restaurant into a profitable and resilient business.
For a deeper understanding of restaurant finances, you can also explore our guide on mastering bookkeeping for restaurant success.
Quick Reference Guide to Key Restaurant Ratios
Every restaurant owner should regularly review a core set of financial and operational ratios. These metrics provide a quick overview of business performance and help identify areas needing improvement.
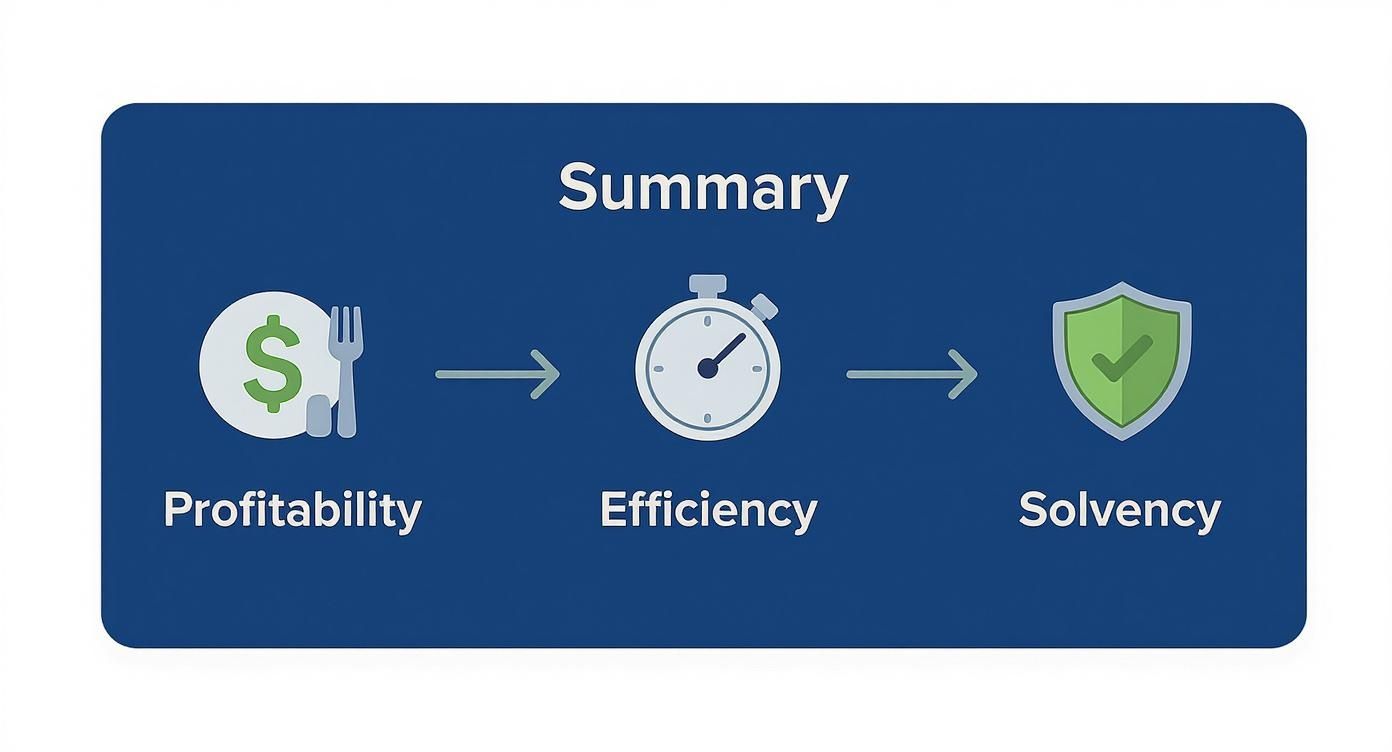
These ratios generally fall into three main categories:
- Profitability: How much revenue becomes profit.
- Operational Efficiency: How effectively your restaurant uses resources.
- Financial Stability: Your ability to meet financial obligations and sustain long-term growth.
Together, these metrics create a complete financial picture of your restaurant’s performance.
Core Profitability Ratios Every Owner Must Know
Profitability ratios measure how effectively your restaurant converts sales into actual profit. These metrics help determine whether your pricing strategy and cost structure support long-term sustainability.
One of the most important profitability metrics is the food cost percentage, which measures how much of your revenue is spent on ingredients. Many restaurant operators aim to keep food and beverage costs between 28% and 35% of total sales.
Tools like a food cost percentage calculator can help calculate this metric accurately.
Profit margins vary depending on the restaurant model. Full-service restaurants often operate with margins between 3% and 5%, while fast-casual operations may achieve margins closer to 6% to 9%.
Understanding these benchmarks allows restaurant owners to adjust menu pricing, portion sizes, and purchasing strategies to maintain profitability.
Managing Expenses with Cost Control Ratios
Cost control ratios help restaurant operators monitor their largest expenses: food and labor. These metrics reveal whether operational costs are aligned with revenue and industry standards.
The most important cost control metric is Prime Cost. Prime cost combines two major expenses:
- Cost of Goods Sold (COGS)
- Total Labor Costs
Prime Cost Formula:
Prime Cost = COGS + Total Labor Costs
Most restaurants aim to keep prime cost between 55% and 65% of total sales. When this number increases beyond the recommended range, it often signals issues with purchasing, portion control, staffing levels, or scheduling.
Effective purchasing and inventory management play a major role in controlling these costs. Implementing strategies such as restaurant supply chain management can significantly reduce food waste and improve cost efficiency.
You can also explore our detailed guide on how to calculate food cost like a professional.
Operational Efficiency Ratios That Drive Performance
Operational efficiency ratios measure how effectively your restaurant uses resources such as seating capacity, inventory, and staff. These metrics provide insights into daily operational performance.
Some of the most important operational ratios include:
- Inventory Turnover – Measures how quickly ingredients are used and replaced.
- Table Turnover Rate – Indicates how often tables are seated during service periods.
- Average Check Size – Measures revenue generated per customer.
A high inventory turnover typically indicates efficient purchasing and minimal food waste. Meanwhile, strong table turnover rates help maximize dining room revenue during peak hours.
By improving these operational metrics, restaurants can significantly increase revenue without increasing seating capacity.
Solvency Ratios for Long-Term Financial Stability
Beyond daily operations, restaurant owners must also evaluate long-term financial stability. Solvency ratios help determine whether a business can manage debt and maintain financial sustainability.
Two of the most important solvency ratios are:
Debt-to-Equity Ratio
This ratio compares total debt to owner or investor equity. Lower ratios generally indicate stronger financial stability because the business relies less on borrowed capital.
Current Ratio
This metric measures short-term financial health and is calculated using the following formula:
Current Ratio = Current Assets ÷ Current Liabilities
A ratio above 1.0 typically indicates that a restaurant has enough short-term assets to cover immediate financial obligations.
Using Technology to Simplify Ratio Tracking
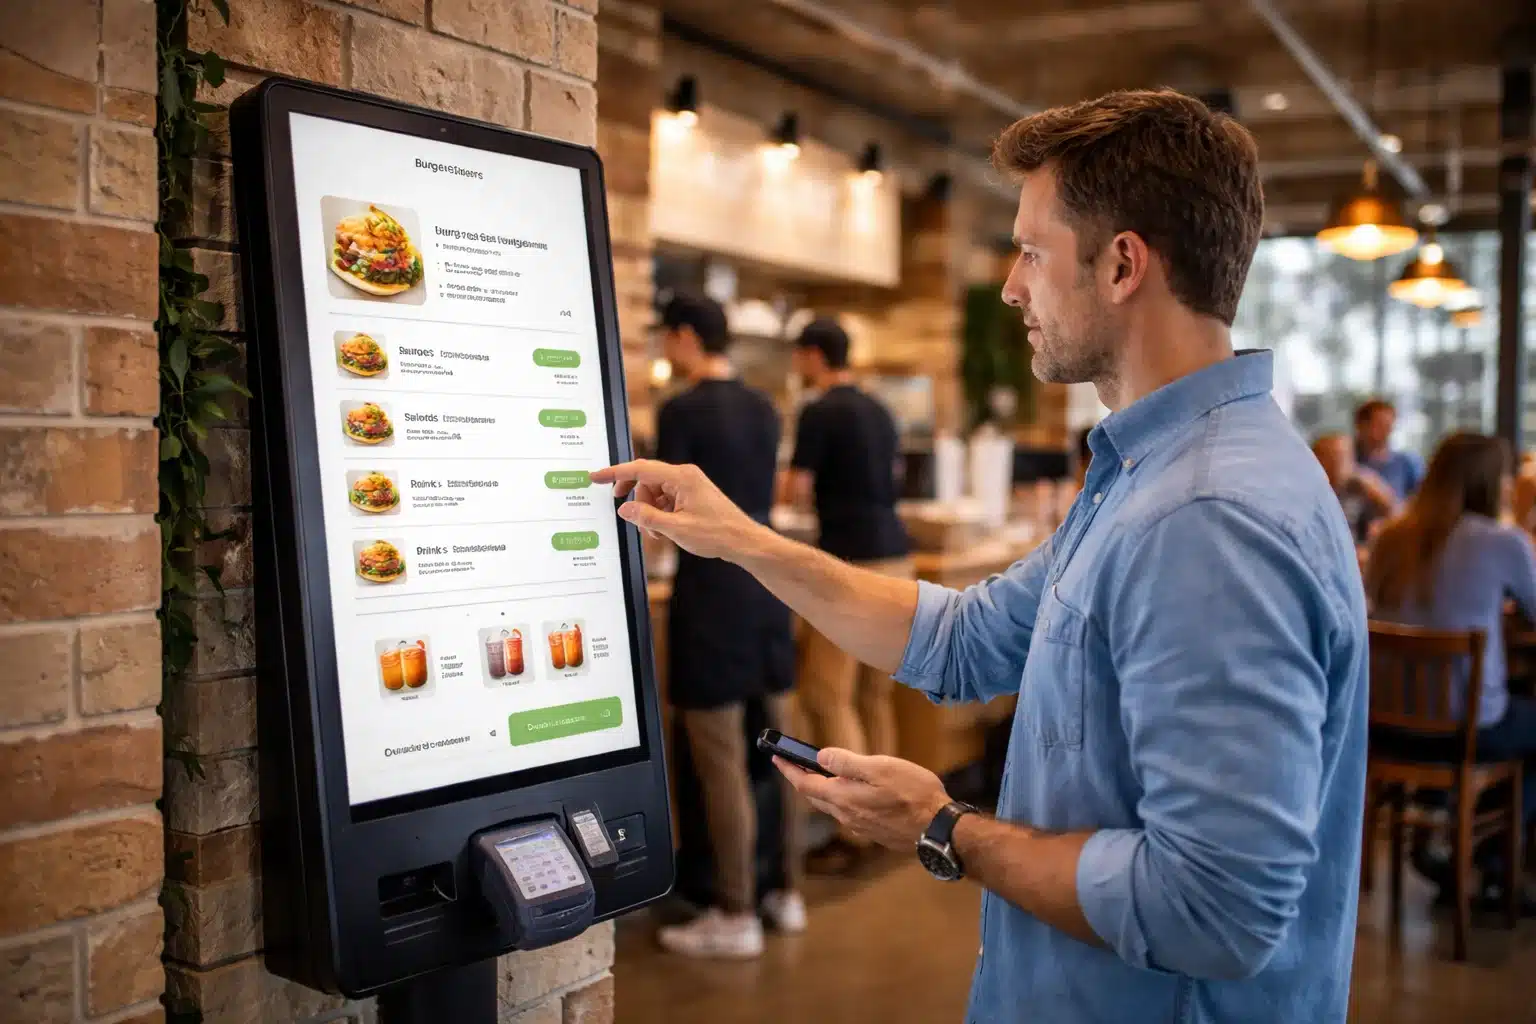
Tracking multiple financial ratios manually can be time-consuming and prone to errors. Modern restaurant technology platforms simplify this process by automatically collecting operational and financial data.
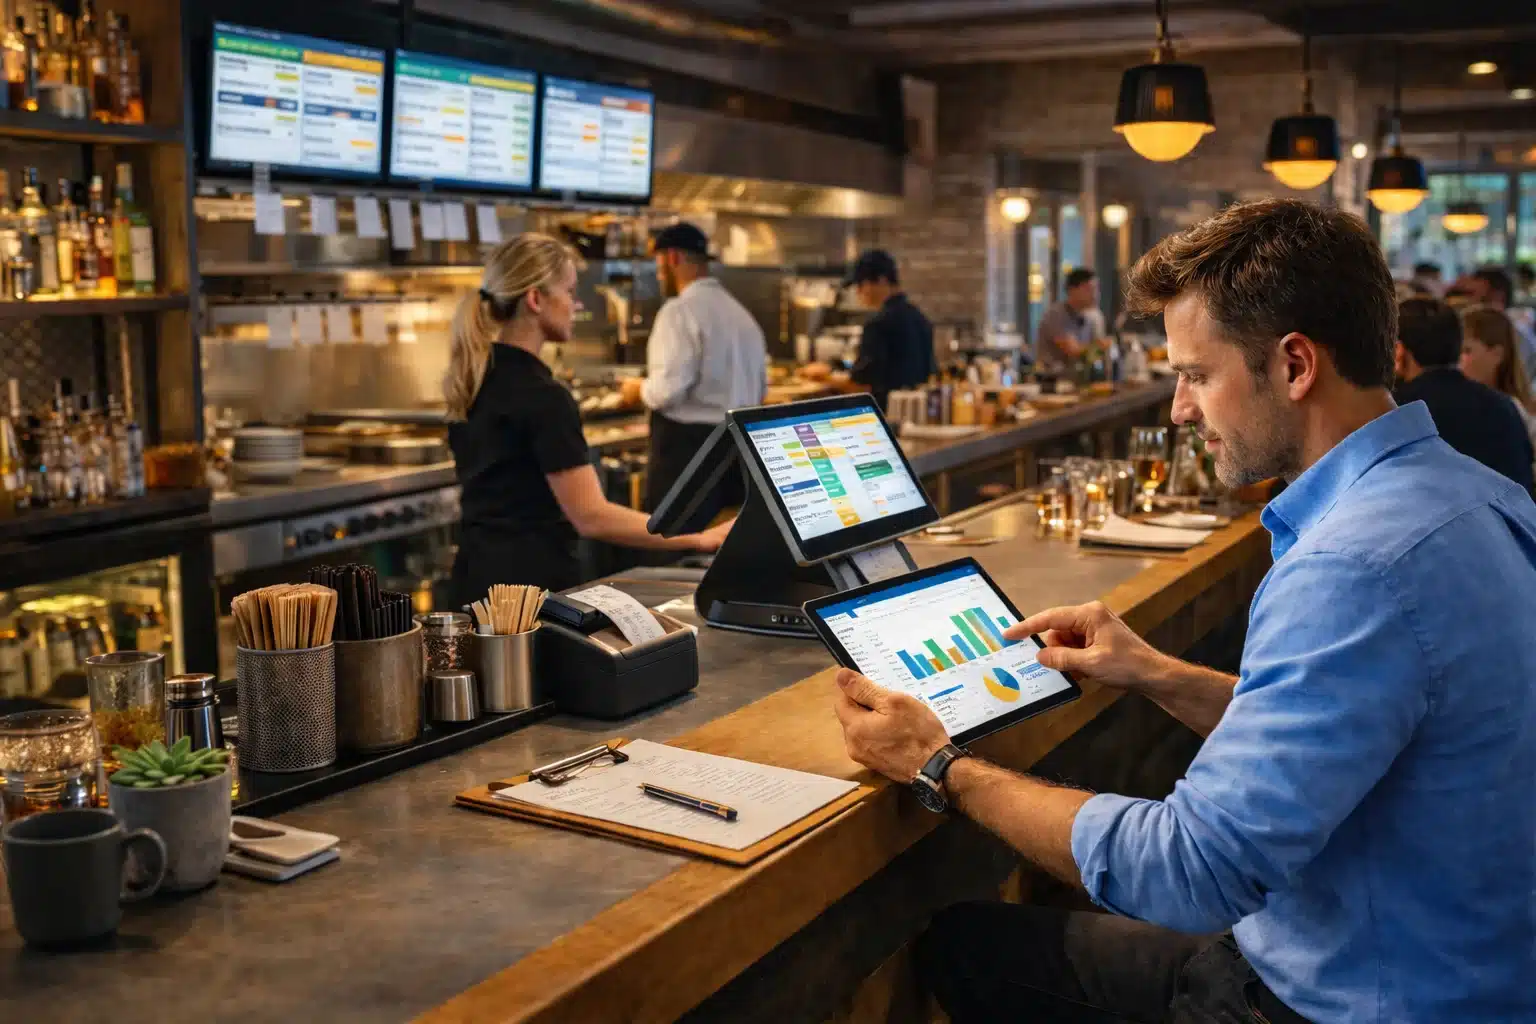
Point of Sale (POS) systems integrate sales, inventory, labor management, and reporting into a single dashboard. This integration allows restaurant owners to monitor critical metrics such as food cost percentage, labor cost, and sales trends in real time.
In a global foodservice market valued at approximately $4.46 trillion, businesses that rely on real-time data insights are significantly better positioned to stay competitive.
Advanced analytics tools allow operators to detect inefficiencies early and make data-driven decisions. Learn more about how restaurant data analytics tools improve operational efficiency.
Frequently Asked Questions About Restaurant Ratios
How often should restaurant ratios be tracked?
Operational metrics such as table turnover and average check size should be monitored daily. Expense ratios like food and labor costs are typically reviewed weekly, while long-term financial ratios can be analyzed monthly or quarterly.
Which financial ratio matters most for new restaurants?
Prime cost is often considered the most important ratio for new restaurants because it combines the two largest controllable expenses: food and labor. Monitoring prime cost closely provides a clear snapshot of operational profitability.
How Biyo Helps Restaurants Track Financial Performance
Tracking financial ratios becomes significantly easier when restaurant data is centralized in one system. Biyo provides an integrated POS platform that connects sales, inventory management, labor tracking, and financial reporting.
This integration allows restaurant owners to monitor key performance indicators such as food cost percentage, labor expenses, average order value, and inventory usage without manually calculating multiple ratios.
Real-time dashboards help operators quickly identify cost issues, monitor profitability trends, and optimize operations based on accurate data insights.
If you want to see how these tools work in practice, you can schedule a quick demo with the Biyo team. Restaurants ready to get started can also create a Biyo account here and explore the platform’s features.