The inventory days on hand formula is a simple but powerful way to measure how efficiently a business manages its inventory. The formula is:
Inventory Days on Hand = (Average Inventory / Cost of Goods Sold) × 365
This calculation reveals how many days, on average, inventory remains in stock before it is sold. While the formula itself is straightforward, the insights it provides are extremely valuable. Businesses use Days on Hand (DOH) to understand inventory efficiency, manage cash flow, and identify opportunities to improve purchasing strategies.
Understanding Inventory Days on Hand and Why It Matters

Inventory Days on Hand (DOH), sometimes called Days Sales of Inventory (DSI), measures how long a company typically holds inventory before selling it. In simple terms, it answers an important operational question: if you stopped purchasing new products today, how many days could you continue selling existing inventory?
This metric is particularly important for businesses that rely heavily on physical products, such as restaurants, retail stores, warehouses, and manufacturing companies.
The Balance Between Overstock and Stockouts
Inventory management requires balance. Holding too much inventory ties up cash that could be used elsewhere in the business. Every unsold item sitting on a shelf represents capital that cannot be used for marketing, payroll, equipment upgrades, or expansion.
However, carrying too little inventory can create the opposite problem. If products run out when customers are ready to purchase, businesses lose sales and risk damaging customer loyalty.
Inventory should be viewed as cash stored in physical form. The longer inventory remains unsold, the longer that cash remains unavailable for other business opportunities.
Why Businesses Track Inventory Days on Hand
Monitoring DOH regularly helps businesses improve operational efficiency and financial stability. The metric provides several important benefits:
- Improved cash flow management: Lower DOH means less capital tied up in unsold inventory.
- Reduced storage costs: Shorter inventory cycles lower expenses related to storage, insurance, and handling.
- Better demand forecasting: Businesses can anticipate purchasing needs based on historical inventory turnover.
- Smarter purchasing decisions: Data-driven insights help businesses order the right quantity at the right time.
The Core Formula for Calculating Inventory Days

The most common version of the inventory days on hand formula is:
Inventory Days on Hand = (Average Inventory / Cost of Goods Sold) × 365
This formula calculates the number of days inventory remains in stock during a specific time period, typically one year.
Breaking Down the Components
| Component | Description | Where to Find It |
|---|---|---|
| Average Inventory | The typical inventory value during the period analyzed. | (Beginning Inventory + Ending Inventory) ÷ 2 |
| Cost of Goods Sold (COGS) | The direct cost of producing or purchasing the products sold. | Income statement |
| Time Period | The number of days used for the calculation. | 365 days for annual analysis |
Calculating Average Inventory
Average inventory represents the typical value of inventory during the time period being analyzed. Because inventory levels fluctuate due to deliveries and sales, using the average value provides a more accurate measurement.
The formula is:
Average Inventory = (Beginning Inventory + Ending Inventory) ÷ 2
This calculation smooths out fluctuations and produces a more realistic measure of inventory levels.
Understanding Cost of Goods Sold
Cost of Goods Sold (COGS) represents the direct cost associated with producing or purchasing products that were sold during the same time period. COGS typically includes raw materials, supplier costs, and production expenses.
However, indirect costs such as marketing expenses, administrative salaries, and office rent are not included in COGS.
The specific calculation of COGS may vary depending on the inventory costing method used by the business, such as FIFO or LIFO.
Alternative Method Using Inventory Turnover
Another way to calculate DOH uses inventory turnover:
Inventory Days on Hand = 365 ÷ Inventory Turnover Ratio
Inventory turnover measures how many times inventory is sold and replaced during a specific time period. Because turnover and DOH measure the same relationship from opposite perspectives, they always move inversely.
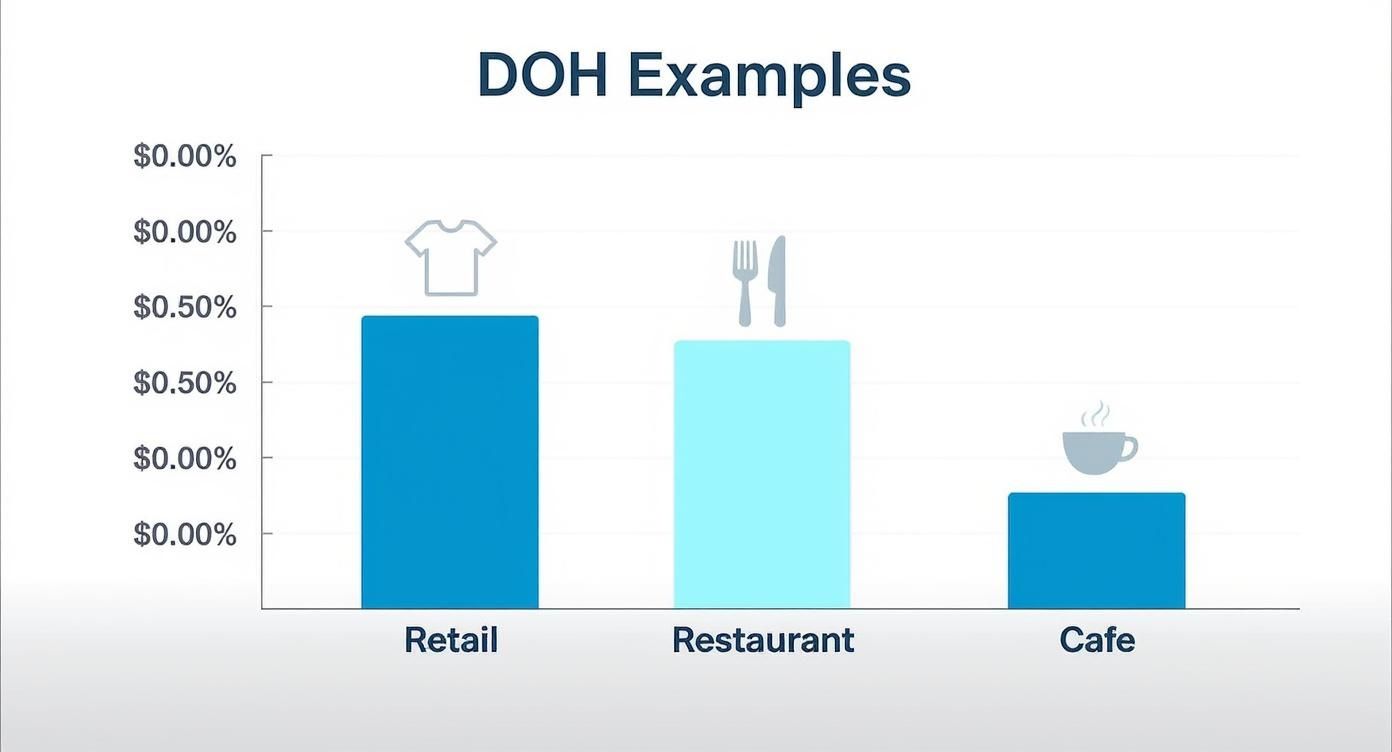
Examples of Inventory Days on Hand Calculations
Understanding the formula becomes easier when applied to real-world examples. Different industries experience different inventory cycles, so DOH varies widely between businesses.
Example: Retail Clothing Store
Suppose a clothing store has:
- Beginning inventory: $60,000
- Ending inventory: $40,000
- Quarterly COGS: $110,000
Average Inventory = ($60,000 + $40,000) ÷ 2 = $50,000
Using a 90-day quarter:
DOH = ($50,000 ÷ $110,000) × 90 = 40.9 days
This result indicates that clothing items remain in inventory for approximately 41 days before being sold.
Example: Restaurant Inventory
A restaurant may operate with the following numbers:
- Beginning inventory: $8,000
- Ending inventory: $6,000
- Weekly COGS: $10,500
Average Inventory = ($8,000 + $6,000) ÷ 2 = $7,000
DOH = ($7,000 ÷ $10,500) × 7 = 4.67 days
Restaurants typically maintain very low DOH because ingredients are perishable and must be used quickly.
Interpreting Your Inventory Days on Hand
The meaning of your DOH value depends heavily on your industry. Some businesses require rapid inventory turnover, while others naturally operate with longer sales cycles.
What a High DOH Means
A high DOH indicates inventory is sitting unsold for long periods. This may suggest overstocking, slow-moving products, or inaccurate demand forecasting.
High DOH often results in:
- Cash tied up in unsold inventory
- Higher storage and insurance costs
- Greater risk of product obsolescence
What a Low DOH Means
A low DOH generally indicates strong sales velocity and efficient inventory turnover. However, extremely low DOH may signal that inventory levels are too lean.
If stock runs out frequently, businesses risk losing customers and revenue opportunities.
Typical Industry Benchmarks
| Industry | Typical DOH Range |
|---|---|
| Restaurants and cafes | 15 – 25 days |
| Grocery stores | 20 – 30 days |
| Fast fashion retail | 30 – 60 days |
| Electronics retail | 40 – 75 days |
| Furniture retail | 80 – 120+ days |
How to Improve Your Inventory Days on Hand

Improving DOH requires better purchasing decisions, stronger demand forecasting, and more efficient inventory tracking.
Use Sales Data to Forecast Demand
Analyzing sales trends helps businesses predict future demand more accurately. This allows companies to order appropriate inventory quantities instead of relying on guesswork.
Implement Reorder Points
Reorder points establish minimum stock levels that trigger new purchase orders. This approach prevents both overstocking and stockouts.
Many businesses automate this process using a restaurant inventory management system.
Reduce Slow-Moving Inventory
Dead stock can significantly increase DOH. Businesses can reduce excess inventory by offering promotions, bundling slow products with popular items, or running clearance sales.
Frequently Asked Questions
What is a good inventory days on hand value?
A good DOH varies by industry. Restaurants typically aim for very low DOH due to perishables, while furniture retailers operate with longer inventory cycles.
How often should DOH be calculated?
Most businesses calculate DOH monthly or quarterly. However, restaurants and fast-moving retail businesses may monitor it weekly.
Can DOH be too low?
Yes. Extremely low DOH may indicate insufficient inventory levels, increasing the risk of stockouts and lost sales.
How does DOH relate to inventory turnover?
Inventory turnover measures how many times inventory is sold during a period, while DOH measures how many days inventory remains in stock. The two metrics are inversely related.
How Biyo Helps Businesses Track Inventory Performance
Tracking inventory metrics manually can be difficult for businesses with large product catalogs or high sales volume.
Biyo POS simplifies inventory management by automatically tracking stock levels, monitoring product sales, and generating detailed reports that help businesses calculate metrics like inventory turnover and Days on Hand.
With real-time inventory analytics, business owners can identify slow-moving products, optimize purchasing decisions, and improve overall operational efficiency.
If you want to see how these tools work in practice, you can schedule a demo with the Biyo team. Businesses ready to get started can also create a Biyo account here and explore the platform’s inventory management features.