A restaurant profit margin calculator is a surprisingly simple tool that answers one of the most important questions in your business: For every dollar you make, how much do you actually keep? It cuts through the noise of total sales to reveal the real financial health of your restaurant, showing you how good you are at turning revenue into profit.
Why Your Restaurant Profit Margin Is So Critical

Let's face it, running a restaurant is a game of inches. The difference between thriving and just surviving often comes down to a few percentage points. Knowing your profit margin isn't just an accounting chore; it's the bedrock of your strategic planning and the guide for your day-to-day decisions.
This one number tells a story about how well your business is running. It’s the difference between guessing and knowing. Without a firm grasp on your profitability, you're flying blind—making critical calls on menu prices, staffing levels, and inventory orders based on gut feelings instead of solid data.
Beyond a Simple Percentage
Think of your profit margin as the pulse of your restaurant. When it's healthy and steady, you know your pricing is on point, your costs are in line, and your team is operating efficiently. On the flip side, a shrinking margin is the first red flag that something is off, giving you a chance to find and fix the problem before it becomes a crisis.
This number is directly tied to your ability to:
- Invest in Growth: Dreaming of a second location, a dining room refresh, or that shiny new combi oven? Those plans are paid for by profit.
- Weather Economic Storms: Unexpected hurdles, like a supplier's price hike or a surprisingly slow Tuesday, are far easier to handle when you have a healthy profit cushion.
- Make Smarter Decisions: A profit margin calculator turns your sales and expense data into real-world intelligence. It gives you the confidence to adjust menu prices, renegotiate with vendors, or tweak staff schedules.
Your profit margin isn't just a number on a spreadsheet. It's the fuel for your restaurant's future, determining your capacity for growth, resilience, and long-term success.
The Reality of Restaurant Margins
The restaurant industry is notorious for its razor-thin margins. Most operators are working within a very narrow window for error, which is why paying close attention to this number is so vital.
To give you some perspective, here are some typical profit margin benchmarks you might see in the industry.
Typical Restaurant Profit Margin Benchmarks
| Restaurant Type | Average Profit Margin |
|---|---|
| Quick-Service Restaurant (QSR) | 6% – 10% |
| Fast Casual | 6% – 9% |
| Full-Service Restaurant (FSR) | 3% – 6% |
| Fine Dining | 3% – 5% |
| Food Truck | 6% – 9% |
Seeing these numbers in black and white makes it clear: every decision counts. Top-performing restaurants don't get lucky; they use data to drive every single efficiency. If you want to learn more, you can read about how leading restaurants are boosting their profitability on gotenzo.com. This is precisely why a dedicated restaurant profit margin calculator isn’t just a nice-to-have tool—it’s an absolute essential.
Getting Your Financial Ducks in a Row
A profit margin calculator is a powerful tool, but its insights are only as good as the numbers you feed it. Before you can get a true read on your restaurant's financial health, you need to pull together three key pieces of financial data. Think of it as your financial mise en place—getting everything prepped and ready makes the final result accurate and genuinely useful.
You're not starting from scratch here. These numbers are already being tracked in the systems you use every single day. It's just a matter of knowing where to look and how to bring them together. This isn't about becoming a CPA overnight; it's about transforming the data you already have into actionable business intelligence.
The infographic below breaks down the three main data sources you'll be using.
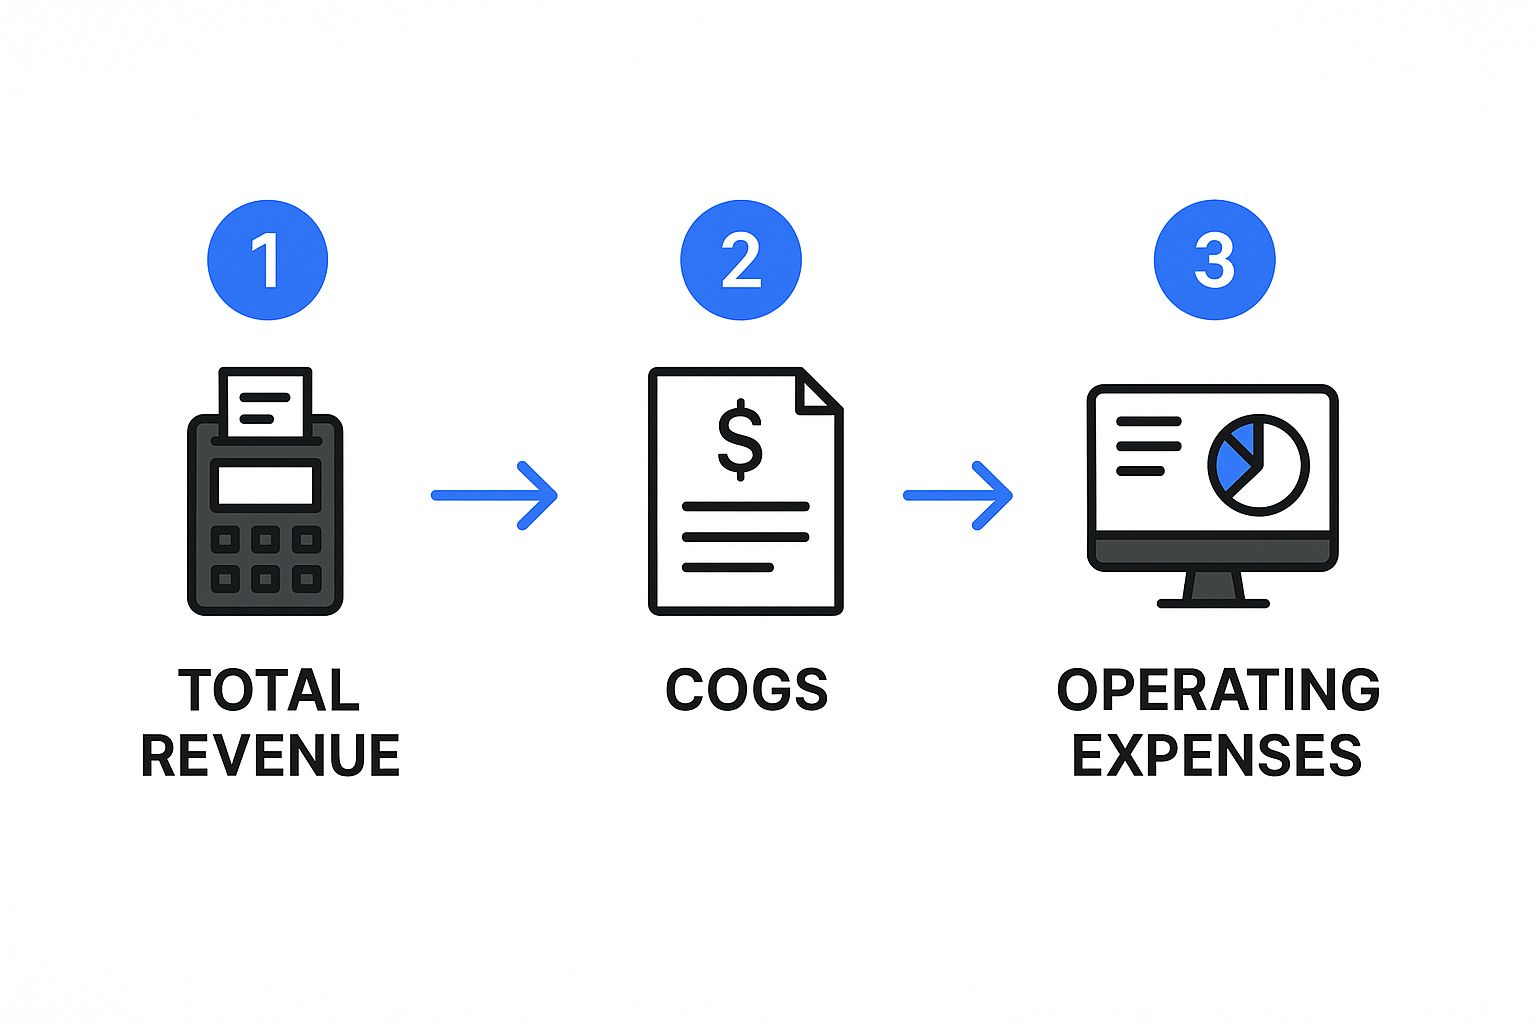
As you can see, it's a straightforward process: your POS system gives you revenue, your supplier records help determine your cost of goods, and your accounting software tracks all other operating expenses.
Finding Your Total Revenue
First things first: your Total Revenue. This is the top-line number, representing every dollar your restaurant earned over a specific period before a single expense is taken out. It’s the raw measure of your sales performance.
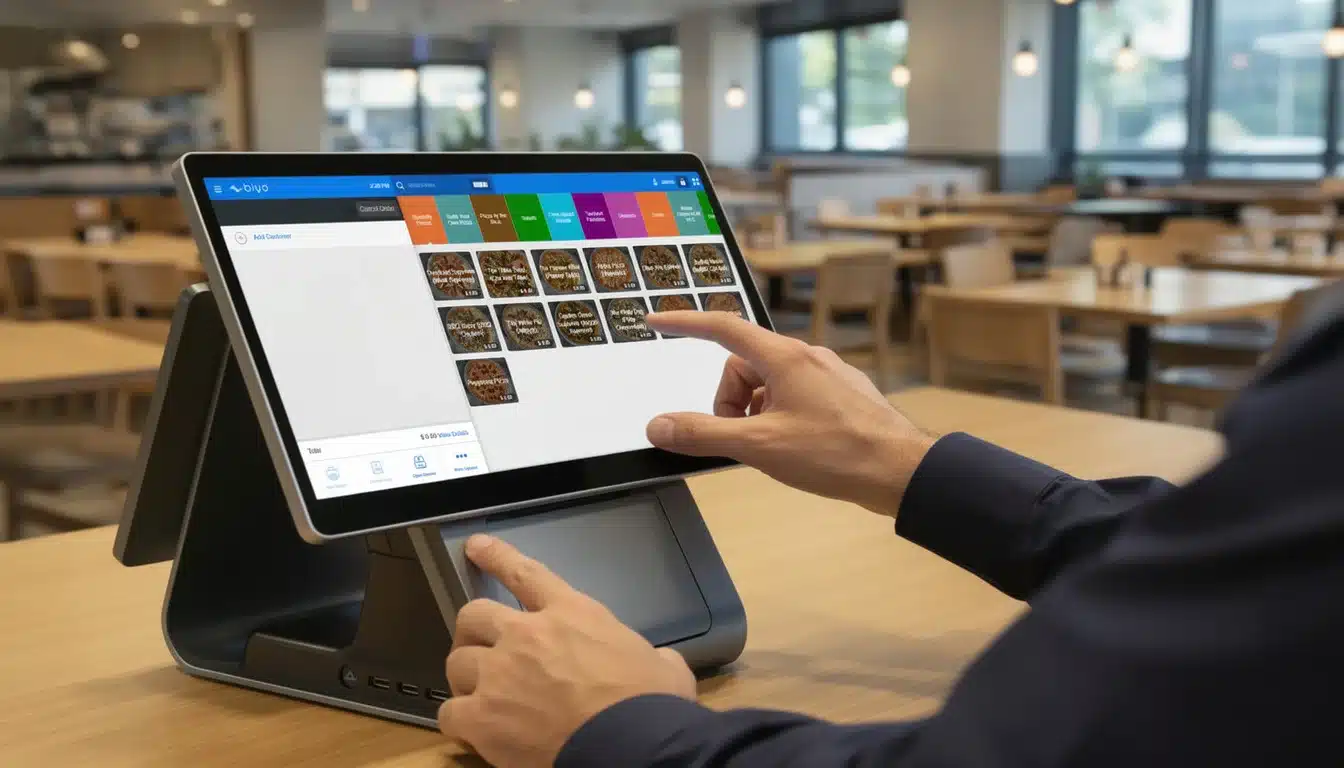
The easiest and most accurate place to find this is your Point of Sale (POS) system. A modern POS like Biyo POS can instantly generate detailed sales reports. Just pull up a "Total Sales" or "Revenue" report for the day, week, or month you're analyzing, and you've got your number.
Nailing Down Your Cost of Goods Sold
Next up is your Cost of Goods Sold (COGS). This is a critical one. It represents the direct cost of every ingredient—food and beverage—that went into the dishes and drinks you sold during that period. Getting your COGS right is the foundation of a profitable menu.
You’ll typically pull this information from a couple of sources:
- Supplier Invoices: These tell you exactly what you paid for all your raw materials.
- Inventory Counts: By comparing your inventory at the beginning of the period to the end, you can see precisely how much product was actually used.
Mastering this calculation is a game-changer for pricing and menu engineering. If you want to dive deeper, you can learn how to calculate food cost like a pro with these essential tips.
Tallying Up Your Operating Expenses
Last but not least, you need to gather your Operating Expenses, what many people just call overhead. These are all the costs of doing business that aren't the ingredients themselves. We're talking about everything from your rent and electricity to staff payroll and marketing costs.
Your best friend here is your accounting software, whether it's QuickBooks, Xero, or another platform. Simply look at your profit and loss (P&L) statement for the same period. It will give you a neatly itemized list of all your non-COGS expenses.
Meet Your Prime Cost: While we separate COGS and Operating Expenses for the calculator, the sharpest operators live and die by their Prime Cost. This is the combination of your COGS and your total labor costs. For most restaurants, a healthy Prime Cost goal is 60% or less of total revenue. Keep a close eye on it—it's the most controllable expense you have.
How to Calculate Your Restaurant's Profitability
Alright, you’ve gathered your key financial ingredients. Now it’s time for the fun part: turning those raw numbers into insights that can actually change your business. Calculating your restaurant's profitability isn't about getting lost in spreadsheets; it's about using a couple of powerful formulas to get a clear picture of your financial health.
We’re going to look at this from two crucial angles. First, we'll dive into your Gross Profit Margin to see how well your menu is performing. Then, we'll zoom out to your Net Profit Margin, which is the ultimate scorecard for your restaurant's success.
To make this crystal clear, let's walk through an example with a fictional cafe we'll call 'The Corner Bistro.'
Uncovering Your Menu's Profitability with Gross Profit Margin
Your Gross Profit Margin tells you exactly how much money is left over from sales after you've paid for the ingredients—the food and beverages. Think of it as a direct report card on your menu pricing and food cost control. A healthy gross margin is a sign that you're turning inventory into revenue efficiently.
The formula itself is pretty simple:
Gross Profit Margin = [(Total Revenue – COGS) / Total Revenue] x 100
Let's plug in the numbers for The Corner Bistro for the month of April:
- Total Revenue: $50,000
- Cost of Goods Sold (COGS): $15,000
First, we find the gross profit: $50,000 (Revenue) – $15,000 (COGS) = $35,000.
Next, we divide that by the total revenue to see it as a percentage: $35,000 / $50,000 = 0.70.
Multiply by 100, and you get your answer. The Corner Bistro's Gross Profit Margin is 70%. This is fantastic. It means for every dollar they make in sales, 70 cents are left to cover labor, rent, and everything else.
Getting your COGS right is absolutely essential for this calculation to be accurate. If you need a deeper dive, check out our guide on how to master the Cost of Goods Sold and boost your profit margins.
Revealing Your True Bottom Line with Net Profit Margin
Gross margin is vital, but it doesn’t tell the whole story. The Net Profit Margin is the real bottom line. It’s the percentage of revenue you actually keep as profit after all the bills are paid—from labor and rent to utilities and marketing. This is the number that truly defines your restaurant’s financial success.
Here's how you calculate it:
Net Profit Margin = [(Total Revenue – Total Expenses) / Total Revenue] x 100
Let's stick with The Corner Bistro's April performance:
- Total Revenue: $50,000
- Total Expenses (COGS + Operating Expenses): $45,000 (This is their $15,000 in COGS plus $30,000 in other operating costs).
First, calculate the net profit: $50,000 – $45,000 = $5,000.
Then, divide that by the total revenue: $5,000 / $50,000 = 0.10.
Multiply by 100, and there you have it. The Corner Bistro’s Net Profit Margin is 10%. In the restaurant world, that's a very strong result.
This final number is what matters most. A 10% net profit means that for every single dollar The Corner Bistro earns, they keep 10 cents. That’s the money left over to reinvest in the business, pay down debt, or take home as a well-deserved reward.
The restaurant industry is notoriously tough. While it’s booming globally, the average profit margins often hover somewhere between 3% and 5%. The top-tier operators might hit 10% or more, which just goes to show how much of a difference sharp management can make. Understanding these benchmarks helps you set realistic goals for your own place.
Now that you know how to get these percentages, the next move is to understand what they mean for your operation and what actions to take. To help you keep these formulas handy, here's a quick reference table.
Essential Restaurant Profit Formulas
Here’s a quick-glance summary of the two key formulas we’ve just discussed. They’re the foundation for understanding your restaurant’s financial performance.
| Formula | Calculation | What It Measures |
|---|---|---|
| Gross Profit Margin | [(Revenue - COGS) / Revenue] x 100 |
The profitability of your menu, showing how efficiently you convert ingredients into sales dollars. |
| Net Profit Margin | [(Revenue - Total Expenses) / Revenue] x 100 |
The overall profitability of your entire restaurant after all costs have been paid. This is your true bottom line. |
Keep these formulas close. They're not just numbers—they're the pulse of your business, telling you where you're winning and where you need to focus your attention.
Turning Your Numbers Into Real Profit
So, you've run the numbers through a profit margin calculator. Great. But that percentage is just a starting point. The real magic happens when you use that number to make smart, strategic decisions that actually grow your business. This is what separates the restaurants that just get by from the ones that truly thrive.
What's a "good" profit margin, anyway? There's no single right answer. It really depends on your concept. A food truck with lean overhead might comfortably hit a 6-9% net profit. On the other hand, a fine-dining spot with huge labor and prime ingredient costs could be doing fantastic at 3-5%. The goal isn't to hit a magic number; it's to understand what your numbers are telling you about your specific operation.
What to Do When Your Gross Profit Margin Is Low
If your gross profit margin looks weak, that’s a direct hit on your menu's performance. This number is all about the gap between your menu prices and what it costs you to make the food (your COGS). A low gross margin is a major red flag, and it means you need to look at your menu, and fast.
Here are a few things you can do right away:
- Become a Menu Engineer: Dive into your POS data. You're looking for your "Stars" (high profit, high popularity) and your "Dogs" (low profit, low popularity). Your job is to push the Stars hard and seriously consider getting rid of the Dogs, or at least re-working the recipe to make them more profitable.
- Talk to Your Suppliers: Don't be shy about shopping around or asking for a better deal. Call up your vendors and see if there's room to negotiate on price. Even a tiny discount on high-volume items can make a massive difference over a month.
- Lock Down Your Portion Control: Consistency is everything. Are your line cooks eyeballing it? Stop that now. Use standardized recipes, portion scoops, and scales for everything. This prevents profit from walking out the door one extra ounce at a time.
These aren't just suggestions; they are direct levers you can pull to immediately improve the profitability of every plate that leaves your kitchen.
What to Do When Your Net Profit Margin Needs a Boost
A healthy gross margin but a low net margin tells a different story. It means your overhead is chewing up all the money your menu is making. Now it’s time to look beyond the food costs and scrutinize everything from labor to your electric bill.
Here’s where to focus your attention:
- Get Smarter with Scheduling: Your sales data is your best friend here. Use it to build schedules that match your customer traffic. Stop overstaffing quiet Tuesday afternoons and make sure you’re ready for the Friday night rush. This is the key to controlling labor costs without sacrificing service.
- Cut Down on Utility Bills: Small changes really do add up. Switching to energy-efficient appliances and LED lighting is a great start. More importantly, train your team to be vigilant about turning off lights and equipment that aren't in use.
- Hunt Down Bloated Operating Costs: It’s time to get cozy with your P&L statement. Are you paying for a marketing service that isn't bringing people in? Can you find a better price on your linen service or pest control? Every dollar you trim from these expenses goes straight to your bottom line.
Your calculator gives you the diagnosis; these strategies are the cure. By focusing on the right areas—whether it's menu profitability or operational overhead—you can systematically improve your financial health.
Making these kinds of adjustments requires a deep understanding of where every dollar is going. For a more detailed guide, check out our article on cost management and increasing restaurant profitability.
It also pays to keep an eye on the bigger picture. The U.S. foodservice industry is on track to hit $1.5 trillion in sales, with a huge chunk of that growth fueled by digital ordering. At the same time, the global fast-food market is projected to reach $381.79 billion by 2033, which shows just how much consumer habits are evolving. Knowing these trends helps you make smarter decisions, and you can explore more restaurant industry statistics on bizplanr.ai to stay ahead of the curve.
Common Profit Calculation Mistakes to Avoid

Punching numbers into a profit margin calculator seems simple enough, right? But I've seen how tiny mistakes can snowball into massive miscalculations. Bad data leads to bad decisions, giving you a completely skewed view of your restaurant’s financial health.
Even experienced operators can slip up. Let’s walk through some of the most common traps I see and how to sidestep them so your numbers are always telling you the truth.
Overlooking the Hidden Costs
This is the big one. It's so easy to focus on the big-ticket items from your main suppliers and completely forget the little things that quietly drain your profits. These costs often fly under the radar but are a very real part of your Cost of Goods Sold (COGS). When they're missing, your gross profit margin looks healthier than it is, masking problems that need fixing.
Make it a habit to track these "invisible" expenses:
- Spoilage and Waste: Every bit of produce that wilts, every over-prepped batch that gets tossed—that's cash in the trash. It directly impacts your COGS.
- Employee Meals: Offering staff meals is a fantastic perk, but those ingredients aren't free. Their cost needs to be accounted for.
- Condiments and Garnishes: Think about all the spices, sauces, oils, and garnishes you use. Individually, they're small. Collectively, they can add up to a significant expense each month.
Forgetting to track things like waste and employee meals is like trying to bake a cake without measuring all the ingredients. You might end up with something, but it won't be what you expected, and you won't know why it went wrong.
Miscategorizing Major Expenses
Another pitfall is putting expenses in the wrong bucket. The classic mix-up is blurring the lines between COGS and Operating Expenses. For example, I often see takeout containers, napkins, and plastic cutlery lumped in with food costs. They aren't. Since customers don't eat them, they’re an operating expense, not an ingredient.
Why does this matter? Because it can seriously inflate your COGS and make your menu items seem way less profitable than they actually are. You might be tempted to hike up menu prices when the real issue is high overhead.
Calculating Too Infrequently
Finally, don't make the mistake of treating your profit margin as a once-a-quarter or, even worse, a once-a-year task. The restaurant world moves at lightning speed. Your produce costs can spike overnight, a new competitor can open down the street, and one slow month can derail your entire financial plan.
You need to be running these numbers at least monthly. This rhythm lets you catch a negative trend before it becomes a full-blown crisis. A monthly check-in transforms your profit margin from a historical report into a forward-looking management tool, giving you the agility to adapt and stay ahead.
Answering Your Top Questions About Restaurant Profitability
When you're running a restaurant, the financial side of things can feel like a constant puzzle. It's only natural to have questions. Getting solid answers is the key to making smart, confident decisions for your business. Let's tackle some of the most common questions we hear from owners.
What’s a Good Profit Margin for a Restaurant?
This is the big one, isn't it? Everyone wants to know the magic number. The honest answer is: it depends entirely on your restaurant's concept. But, if you're looking for a benchmark, a net profit margin of 10% or higher is a fantastic goal to shoot for.
To get more specific, here’s what we typically see out in the wild:
- Quick-Service & Fast Casual: These spots often have the healthiest margins, usually landing somewhere between 6% and 9%.
- Full-Service Restaurants: The margins here are notoriously thin. A well-run full-service spot usually pulls in 3% to 6%.
- Bars & Breweries: Thanks to the high-profit nature of beverage sales, these businesses can see much higher margins, sometimes getting into the 10% to 15% range.
The real takeaway here is to stop chasing an arbitrary number. Instead, benchmark your performance against similar restaurants and focus on making small, consistent improvements month over month.
How Often Should I Be Calculating My Profit Margin?
Don't treat this like a once-a-year task you do for your accountant. To stay on top of your business and catch problems before they snowball, you should be plugging your numbers into a restaurant profit margin calculator at least once a month.
Looking at your margin monthly turns it from a historical report into a powerful management tool. It helps you react fast when you see food costs creeping up, notice your labor schedule is inefficient, or realize a menu item just isn't pulling its weight.
What's the Difference Between Gross and Net Profit Margin?
Getting a handle on these two metrics is absolutely crucial. They tell two very different, but equally important, stories about your restaurant's financial health.
- Gross Profit Margin is all about the profitability of what you sell. It shows you how much money you have left over from sales after you’ve paid for the ingredients (your Cost of Goods Sold). A strong gross margin means you’ve priced your menu well.
- Net Profit Margin is the real bottom line. This is the percentage of revenue you actually get to keep after all the bills are paid—labor, rent, utilities, marketing, you name it. This number is the ultimate test of your restaurant’s success.
Think of it this way: Gross Profit is what your kitchen earns from the menu. Net Profit is what the business actually keeps in its pocket. It's entirely possible to have a fantastic gross margin but a terrible net margin if your overhead costs are spiraling out of control.
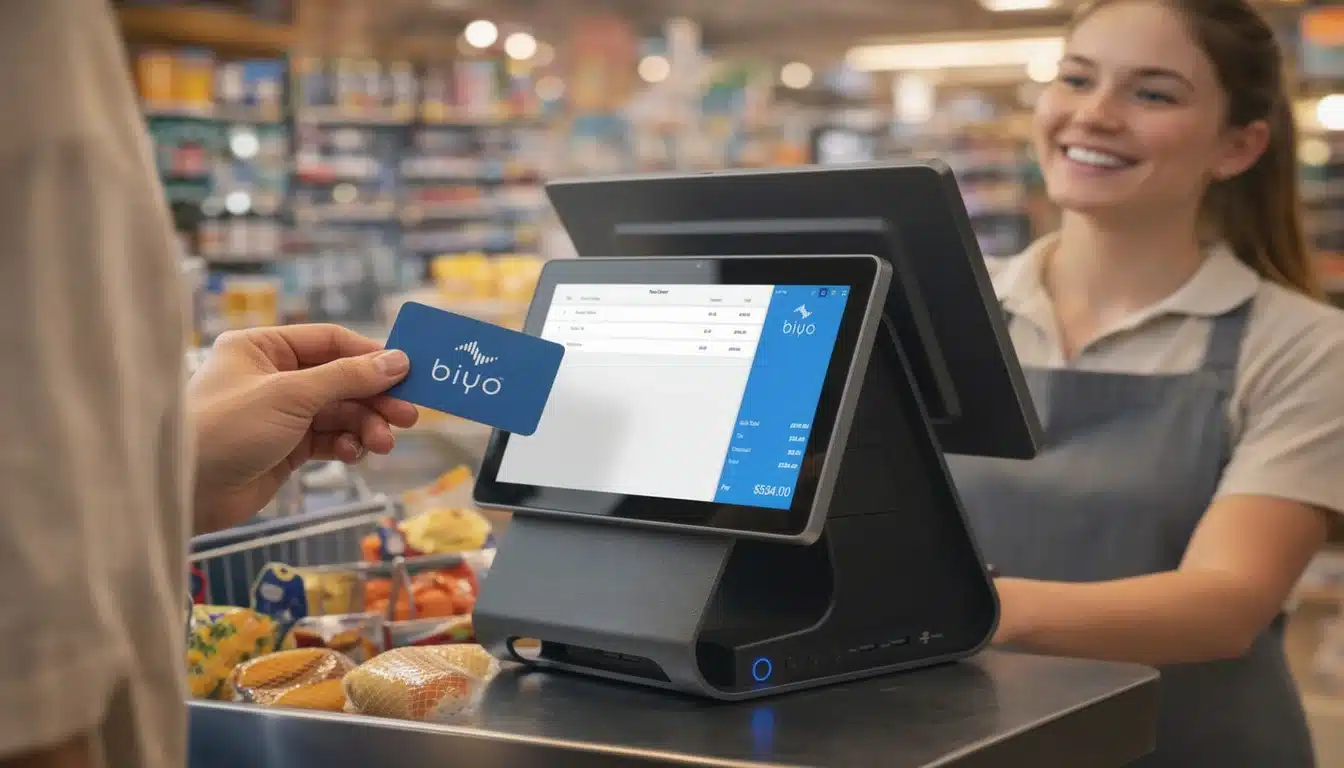
Ready to stop guessing and take firm control of your restaurant's profitability? A system that tracks every sale and cost in real-time is a game-changer. Biyo POS provides the powerful, easy-to-read reports you need to make data-driven decisions. Streamline your operations, get a handle on your inventory, and unlock the insights that truly drive growth. Start your free 14-day trial today!