Think of the stock sitting in your backroom or on your shelves. It's not just stuff—it's cash. Inventory Days on Hand (DOH), sometimes called Days Sales of Inventory (DSI), tells you how long that cash sits tied up in products before you sell them. This isn't just a number for accountants; it's a fundamental health check for your business.
What Inventory Days On Hand Actually Tells You

You can think of your DOH as a speedometer for your inventory. It measures the average number of days it takes for an item to go from your stockroom into a customer's hands. Getting a handle on this metric is critical for managing your cash flow, keeping storage costs down, and avoiding the nightmare of product spoilage or obsolescence.
At its core, DOH is an early warning system. If the number starts creeping up, it could be a red flag for slowing sales or overzealous purchasing. If it's dropping, that might signal strong demand—or that you're about to run out of stock entirely.
Why This Metric Is So Important
Keeping a close eye on your DOH gives you a direct line of sight into your operational efficiency and financial health. When you know your number, you can stop guessing and start making smart, data-backed decisions that grow your bottom line.
Here’s what you gain by managing your DOH effectively:
- Better Cash Flow: The faster you sell inventory, the quicker you turn it back into actual money. That cash is then free to pay suppliers, invest in new product lines, or cover day-to-day business costs.
- Lower Carrying Costs: Every day an item sits on your shelf, it costs you money. You’re paying for warehouse space, insurance, and security, not to mention the risk of damage. A lower DOH means less cash is wasted on just holding stock.
- Less Product Waste: If you're running a cafe or restaurant, a high DOH is a recipe for spoiled ingredients and lost profit. For a retailer, it means products go out of season or become obsolete before you can sell them.
By tracking Inventory Days on Hand, you get a crystal-clear picture of how hard your capital is working for you. It ensures your money is actively making more money, not just sitting on a shelf collecting dust.
A Look at Industry Averages
So, what’s a “good” DOH? There's no magic number—it varies wildly from one industry to another. In the retail world, the average DOH hovers around 50 days, meaning most shops hold onto their stock for a month and a half.
But this changes drastically depending on what you sell. A grocery store, for instance, has to move products much faster due to spoilage, so their DOH is typically much lower, often between 20 and 30 days. To see how your business stacks up, you can discover more inventory statistics and insights and compare benchmarks across different sectors.
How to Calculate Inventory Days On Hand Correctly
Figuring out your inventory days on hand might sound intimidating, but it’s actually a pretty straightforward calculation. Think of it as a tool that replaces guesswork with solid data, giving you a clear picture of how long your products are actually sitting on the shelves before they sell.
The core formula is your starting point:
DOH = (Average Inventory / Cost of Goods Sold) x Number of Days in Period
Let's pull apart each piece of this puzzle. Once you see how they fit together, you'll be able to calculate this metric for your own business in no time.
Finding Your Average Inventory
First things first, you need your Average Inventory. Why not just use today's stock count? Because inventory levels are always in flux—sales, new deliveries, and even returns can make a single day's number misleading. An average smooths out these peaks and valleys, giving you a far more reliable view of your typical stock.
Here's the simple formula to get that number:
- Average Inventory = (Beginning Inventory + Ending Inventory) / 2
So, if you started the month with $10,000 in stock and ended it with $12,000, your average inventory is $11,000. That's the number that truly represents the value of stock you carried throughout that month.
Understanding Cost of Goods Sold
Next up is the Cost of Goods Sold (COGS). This is a crucial number that reflects the direct costs tied to the products you've sold. It covers the price of the materials and anything else that went directly into creating or acquiring those items. What it doesn't include are indirect costs like marketing or shipping.
You can usually pull your COGS right from your business's income statement for the period you're looking at. Getting this number right is essential, as its accuracy directly impacts your final DOH calculation. If you want to get into the weeds, the specific inventory costing method your business uses plays a big role here.
Choosing the Right Time Period
The last piece you need is the Number of Days in the Period. One of the best things about the DOH formula is its flexibility—you can adjust the timeframe to fit whatever you're trying to measure.
Most businesses stick to one of these common periods:
- Annual: Use 365 days for a big-picture, yearly view of your inventory health.
- Quarterly: Use 90 or 91 days for a regular performance check-up.
- Monthly: Use 30 or 31 days. This is perfect for businesses with fast-moving goods who need a more frequent pulse on their stock.
Once you have these three components—Average Inventory, COGS, and your time period—you can plug them into the formula. Just like that, you've calculated your inventory days on hand and can start making smarter, data-driven decisions for your business.
Putting the DOH Formula into Practice
It's one thing to understand the theory, but seeing the inventory days on hand formula in action is when it really clicks. Let's move beyond the abstract numbers and apply this to a couple of real-world businesses. This is where a simple calculation transforms into a powerful tool for making smarter business decisions.
We'll walk through two different scenarios—a busy neighborhood cafe and a seasonal fashion shop—to see how DOH tells a unique story for each.
Example 1: The Busy Neighborhood Cafe
Picture a small, popular cafe where freshness is everything. For a business like this, holding onto perishable items like milk, bread, and coffee beans for too long is a recipe for disaster. It leads directly to waste and eats into profits. A low DOH isn't just a nice-to-have metric; it's essential for survival.
Let's run the numbers for a typical 30-day month:
- Beginning Inventory: $3,000
- Ending Inventory: $3,400
- Cost of Goods Sold (COGS): $12,800
First, we need the average inventory value for the month:
($3,000 + $3,400) / 2 = $3,200
Now, we can plug this into our DOH formula:
($3,200 / $12,800) x 30 Days = 7.5 Days
What does this 7.5 days figure mean? It tells the cafe owner that, on average, they sell through their entire stock of ingredients every week and a half. For a business dealing with fresh products, this is a fantastic number. It points to sharp ordering, high demand, and very little waste.
Example 2: The Seasonal Fashion Boutique
Now, let's switch gears to a clothing boutique that just dropped its new winter coat collection. Unlike the cafe's perishable goods, these coats won't spoil, but they are incredibly time-sensitive. If they don't sell by the time the weather warms up, they become dead stock—tying up cash and taking up precious retail space.
Here’s a look at their numbers over a 90-day quarter (the winter season):
- Beginning Inventory (Start of Winter): $25,000
- Ending Inventory (End of Winter): $15,000
- Cost of Goods Sold (COGS): $20,000
First, let's find the average inventory:
($25,000 + $15,000) / 2 = $20,000
And now, we calculate the DOH for the season:
($20,000 / $20,000) x 90 Days = 90 Days
A DOH of 90 days is a major lightbulb moment for the boutique owner. It means they're holding just enough inventory to last the entire winter season. This might be exactly what they planned, but it's also a yellow flag. If sales dip unexpectedly, they'll be stuck with a mountain of unsold coats. This DOH score is a clear signal to watch sales trends like a hawk and maybe start planning a mid-season promotion to keep things moving.
In both of these cases, DOH provides clear, actionable intelligence. Of course, tracking these numbers manually can be a huge chore. For a deeper look into the systems that automate these crucial calculations, check out our guide on what is inventory management software.
Interpreting Your DOH Score for Better Decisions
Alright, so you've calculated your inventory days on hand (DOH). What now? The number itself is just the starting point. The real magic happens when you learn to read the story it's telling about your business.
Think of your DOH as a vital sign for your operational health. It’s not about passing or failing; it's a diagnostic tool that reveals how well your cash is flowing, how quickly your products are moving, and how efficient your entire inventory process really is. A single DOH figure on its own is pretty meaningless—its true value comes from tracking it over time and stacking it up against others in your field.
What's a "Good" DOH Score, Anyway?
This is the million-dollar question, and the honest answer is: it depends. There’s no single "perfect" DOH. What’s fantastic for a coffee shop selling fresh-baked croissants would be a disaster for a boutique selling designer handbags. Your ideal number is completely tied to your industry, the products you sell, and your business model.
This graphic paints a clear picture of how different a healthy DOH can look for two very different businesses.
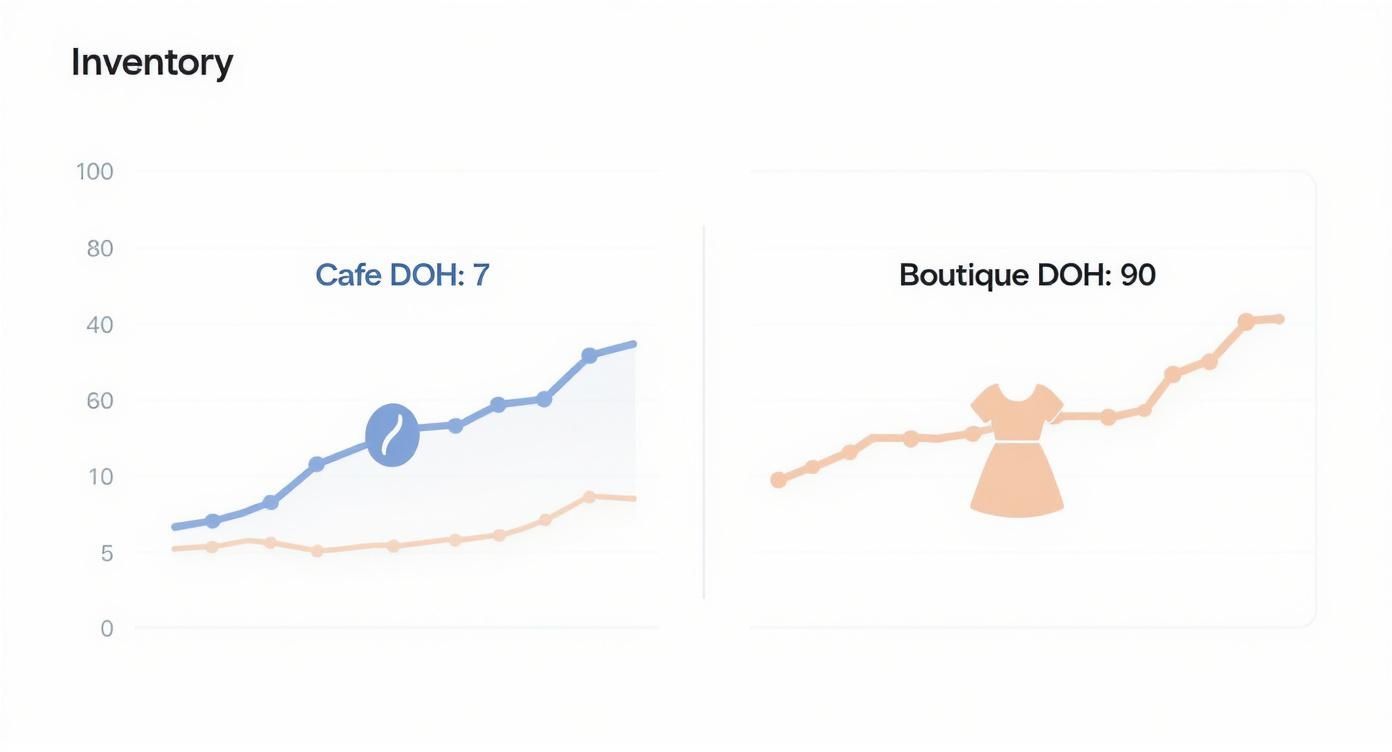
See how the cafe’s low DOH shows it’s efficiently managing perishable food, while the boutique’s much higher DOH makes sense for its seasonal, slower-moving items? Each is "good" for its specific context.
So, what story is your DOH telling you? Let's break down the two extremes.
- A High DOH: This is usually a red flag for overstocking. It means your cash is trapped in inventory that isn't selling, which racks up storage costs and increases the risk of products becoming obsolete, damaged, or spoiled. It could be a sign that sales are slowing down or your purchasing strategy is off.
- A Low DOH: This is generally what you want to see, but an extremely low number can spell trouble. It might mean you're understocked and skating dangerously close to stockouts. Running out of popular items means lost sales and, even worse, unhappy customers who might not come back.
The goal isn't just to slash your DOH to the lowest possible number. It's about finding that perfect balance—the "sweet spot" where you have just enough inventory to satisfy your customers without tying up too much cash or risking waste. That's where profitability lives.
Finding Your Industry Benchmark
To get a real sense of how you're doing, you need to look beyond your own four walls and see how you compare to the competition. This is where industry benchmarks come in.
Here's a look at some typical DOH ranges across different sectors. This table gives you a general idea of what's considered normal, helping you see if your numbers are in the right ballpark.
Typical Inventory Days On Hand By Industry
| Industry Sector | Typical DOH Range (Days) | Key Considerations |
|---|---|---|
| Grocery & Food Service | 5 – 15 | Heavily influenced by perishable goods and spoilage risk. Freshness is paramount. |
| Fast Fashion & Apparel | 60 – 90 | Balances fast-moving trends with seasonal collections. High risk of obsolescence. |
| Electronics | 30 – 50 | Driven by rapid product innovation and short life cycles. Old tech loses value quickly. |
| Automotive Parts | 45 – 70 | Wide range of SKUs with varying demand. Must balance having parts for common repairs. |
| Furniture & Home Goods | 80 – 120 | Larger, higher-cost items with slower sales cycles. Often includes floor models. |
Remember, these are just averages. Your own DOH might be different based on your specific niche, but knowing these benchmarks gives you a crucial frame of reference.
Understanding your DOH is also directly linked to another essential metric. To get the full picture of your inventory performance, check out our guide on how to calculate inventory turnover. The two metrics work hand-in-hand to reveal just how effectively you’re managing your stock.
Actionable Strategies to Optimize Your DOH

Knowing your inventory days on hand (DOH) is the first step. The real work begins when you start taking action to improve it. Optimizing your DOH isn't about making one huge, drastic cut. It’s about implementing a series of smart, sustainable habits that create a leaner, more profitable business.
By actively working to lower your DOH, you’re not just moving boxes—you’re freeing up cash, slashing waste, and becoming far more responsive to what your customers actually want. The goal is to find that sweet spot where you always have enough stock to meet demand, without letting your capital gather dust on the shelves.
Improve Your Demand Forecasting
Good inventory management starts with great forecasting. Instead of relying on gut feelings, you need to dig into your own historical sales data. Start looking for the rhythms in your business—the patterns tied to seasons, holidays, or even specific days of the week.
This data-driven approach lets you anticipate what's coming with much greater confidence. A solid forecast means you order the right amount of stock at the right time, preventing both the financial pain of overstocking and the customer frustration of stockouts.
To get started, try this:
- Analyze Sales History: Pull up your POS reports. Which items are your stars, and when do they shine brightest? Look for those consistent peaks and lulls in demand.
- Factor in External Events: Think about what's happening outside your doors. Are there local festivals, major holidays, or seasonal shifts that will affect sales? Plan your inventory around them.
- Monitor Trends: Keep an eye on your industry. A new trend could create a sudden spike in demand for a product you never expected.
Adopt a Just-In-Time (JIT) Approach
The Just-In-Time (JIT) inventory model can be a game-changer for slashing your DOH. The idea is wonderfully simple: you receive goods from suppliers only as you need them, rather than holding massive amounts of stock in your back room.
This method dramatically cuts your carrying costs and nearly eliminates the risk of inventory becoming obsolete. But be warned: JIT demands incredible coordination and trust with your suppliers. There’s very little room for error if a delivery is late.
By minimizing the time inventory spends sitting in your storeroom, a JIT system directly lowers your inventory days on hand and turns that idle stock back into cash you can actually use.
Strengthen Your Supplier Relationships
Your suppliers aren't just vendors; they're partners in your success. Building strong, collaborative relationships can unlock huge improvements in your operational flexibility and efficiency.
A good relationship isn't just about friendly chats—it translates into real benefits like shorter lead times, more reliable delivery schedules, and maybe even some wiggle room on minimum order quantities. When your supplier truly understands your business, they can help you create a much more responsive supply chain. This partnership is absolutely key to keeping a low DOH without risking empty shelves.
Use Modern Inventory Management Software
Let’s be honest: tracking inventory with spreadsheets is a recipe for headaches and errors. Modern inventory management software, often built right into POS systems like Biyo, automates the entire process.
These systems give you a live, real-time view of your stock levels across every location. They can track sales automatically, flag items that are running low, and give you the exact data needed to calculate your DOH in seconds. Beyond just tracking, implementing effective inventory management strategies is what keeps your DOH lean and your operations smooth. With the right tools, you can stop reacting to problems and start making smart, proactive decisions based on solid data.
Frequently Asked Questions About Inventory Days On Hand
Once you get the hang of the basic formula for inventory days on hand, you'll likely run into some practical questions about how to apply it to your own shop or restaurant. Let's walk through a few of the most common ones that come up.
Getting these details right is what separates just knowing the numbers from actually using them to make smarter decisions.
How Often Should I Calculate My Inventory Days On Hand?
Honestly, there’s no single right answer here—it all comes down to the pace of your business. The goal is to match your calculation frequency to your sales cycle.
- For fast-paced businesses like a bustling cafe, a restaurant, or a local grocery, you’re dealing with products that move quickly (and often perish). Calculating DOH monthly, or even weekly, is a must. It’s the only way to react fast enough to prevent waste and stay on top of demand.
- For businesses with a slower burn, like a furniture showroom or a high-end clothing boutique, a quarterly check-in usually does the job. You’ll still get a clear picture of what’s happening without getting bogged down in daily numbers.
The real key isn't how often you do it, but that you do it consistently. Regular, scheduled tracking is what will help you spot a trend before it turns into a problem.
Can My Inventory Days On Hand Be Too Low?
Yes, it absolutely can. While we often celebrate a low DOH as a sign of efficiency, a number that’s too low is a major red flag. It’s a classic sign of understocking, which puts you at serious risk of stockouts.
Think of it this way: An extremely low DOH suggests your supply chain has no buffer. It’s too lean, and you won’t be able to handle a sudden rush of customers. The goal isn't to get to zero; it's to find that sweet spot where you’re efficient but still prepared.
Running out of your best-selling items doesn’t just cost you that one sale. It can damage your reputation and send loyal customers looking elsewhere.
What Is the Difference Between DOH and Inventory Turnover?
These two metrics are basically two sides of the same coin. They both tell you how well you’re managing your stock, just from different angles. They’re also inversely related—when one goes up, the other goes down.
- Inventory Days on Hand (DOH) tells you how much time you have. It answers the question, "How many days will my current stock last?"
- Inventory Turnover tells you how fast your stock moves. It answers the question, "How many times did I sell through my entire inventory in the last year?"
Most business owners I talk to find DOH more intuitive for day-to-day decisions. It’s much more tangible to think, "We have 45 days of this product left," than it is to know your annual turnover rate is eight. Both are useful, but DOH often feels more immediately actionable.
Ready to stop guessing and start making data-driven decisions? Biyo POS has powerful inventory management and analytics tools built right in, making it simple to automatically track metrics like Inventory Days On Hand. Discover how Biyo can streamline your operations and give you the insights you need to grow.