
Learning how to track draft beer yield is the single most critical discipline for protecting beverage profit margins in modern bars, brewpubs, and craft taprooms. When reviewing monthly financial ledgers, bar operators often celebrate strong gross sales while wondering why draft beer pour costs sit at an alarming twenty-six percent. In a well-managed draft program, draft beer cost of goods sold (COGS) should easily hover between fourteen and eighteen percent. The difference represents thousands of dollars in unmetered, liquid inventory pouring straight down the drip tray every weekend.
Unfortunately, many venue owners treat draft beer as an untrackable bulk commodity. When a half-barrel keg arrives from a distributor, staff simply tap it in the walk-in cooler, run lines to the tap tower, and assume that all 1,984 fluid ounces will convert into customer revenue. In reality, industry-wide draft beer shrinkage routinely hits twenty to twenty-five percent. Pouring beer involves complex physics, mechanical hardware, and human behavior. When temperatures fluctuate, foam pours down the drain, and when busy bartenders rush, unrecorded complimentary drinks slip across the pine unnoticed.
However, operating a profitable taproom does not mean accepting mysterious inventory shrinkage as the cost of doing business. In fact, modern hospitality operators can track draft beer yield with precision by reconciling real-time flow-meter dispense data against registered point-of-sale pour reports. By comparing physical ounces dispensed at the tap shank against electronic ring-ups on each shift, you can pinpoint the exact source of beer loss immediately. This comprehensive masterclass details the mathematics of draft yield, breaks down draught system engineering, and provides the step-by-step auditing blueprints required to eliminate keg waste.
Table of Contents
- The Invisible Drain: Why Unaudited Draft Beer Destroys Bar Profits
- Mechanical Causes of Draft Loss: Foam, Temperature, and Pressure
- Behavioral Causes of Draft Shrinkage Behind the Pine
- Flow-Meter Telemetry: Capturing Pulse Dispense Data at the Shank
- Reconciling Flow-Meter Telemetry with POS Pour Reports
- Side-by-Side Comparison
- How Biyo POS Automates Draft Yield Auditing and Variance Tracking
- Frequently Asked Questions
The Invisible Drain: Why Unaudited Draft Beer Destroys Bar Profits
Draft beer represents one of the highest gross-margin products in hospitality, yet it suffers from the highest operational shrinkage of any beverage category. Packaged bottles and cans provide a closed one-to-one inventory loop; you buy twenty-four cans, you ring up twenty-four cans, and you count the remaining cans in the cooler. In contrast, draft beer is a continuous liquid stream that is vulnerable to loss at every point between the keg coupler and the customer glass.
Consequently, failing to audit draft output creates massive financial leaks that quietly erode bar net profits. Understanding the underlying mathematics of keg yield is the first step toward fixing your draft beverage program.
The Anatomy of Draft Shrinkage: Where 20% of Every Keg Vanishes
A standard American half-barrel keg contains exactly 15.5 gallons, which equals 1,984 fluid ounces of beer. In a theoretical operating environment with zero waste, that keg should generate 124 full 16-ounce pint pours. However, in an unmonitored bar environment, average keg yield hovers between 92 and 98 paid pints.
Where do the missing twenty-six pints go? That vanished volume breaks down into specific operational categories:
- Over-Foaming and Excessive Head Dumping: Ten to twelve pints lost as bartenders dump foam down the drip tray while waiting for clear beer to pour.
- Over-Portioning and Rim-Filling: Six to eight pints lost when staff fill oversized glasses to the brim without leaving a proper one-inch foam collar.
- Line Cleaning and Maintenance Purges: Two to three pints lost per tap line during routine bi-weekly chemical line flushes.
- Unrecorded Staff Comps and Free Samples: Six to eight pints given away as unrecorded taste samples, staff shift drinks, or friendly comps.
The Financial Math: 124 Pints vs. 14-Ounce Cheater Glasses
The financial impact of draft shrinkage compounds rapidly across a multi-tap venue. Consider a craft taproom running thirty active tap lines, turning sixty half-barrel kegs each month at an average retail price of $7.50 per pint:
- Theoretical Monthly Revenue (100% Yield): 60 Kegs * 124 Pints * $7.50 Retail = $55,800.00
- Actual Unaudited Monthly Revenue (78% Yield / 96 Pints): 60 Kegs * 96 Pints * $7.50 Retail = $43,200.00
- Monthly Topline Revenue Lost to Shrinkage: $12,600.00 per month ($151,200.00 annually)
Furthermore, glassware selection directly distorts yield mathematics. Many bars serve beer in standard 16-ounce conical mixing glasses, which hold 14.5 ounces of liquid alongside a 1.5-ounce foam head. Other bars use 14-ounce “cheater glasses” that look like full pints but hold only 12.5 ounces of beer. If your POS charges for a standard pint while your bartenders pour without portion control, your financial reporting loses all accuracy. Therefore, operators must track draft beer yield using precise liquid volume metrics rather than vague glass estimates.
 Mechanical Causes of Draft Loss: Foam, Temperature, and Pressure
 Mechanical Causes of Draft Loss: Foam, Temperature, and Pressure
Before blaming bartenders for missing beer, venue managers must audit the physical mechanics of their draft dispensing system. A poorly balanced draft system forces even the most conscientious bartender to dump foam down the drain to pour a single clean pint.
Consequently, maintaining proper temperature, applied gas pressure, and line resistance is essential for maximizing keg yield. Eliminating mechanical foaming solves over half of all draft beer shrinkage.
Balancing Draught Systems: Glycol Chiller Temps and Dynamic Resistance
Beer is a carbonated liquid that requires precise temperature and pressure equilibrium to remain stable in the line:
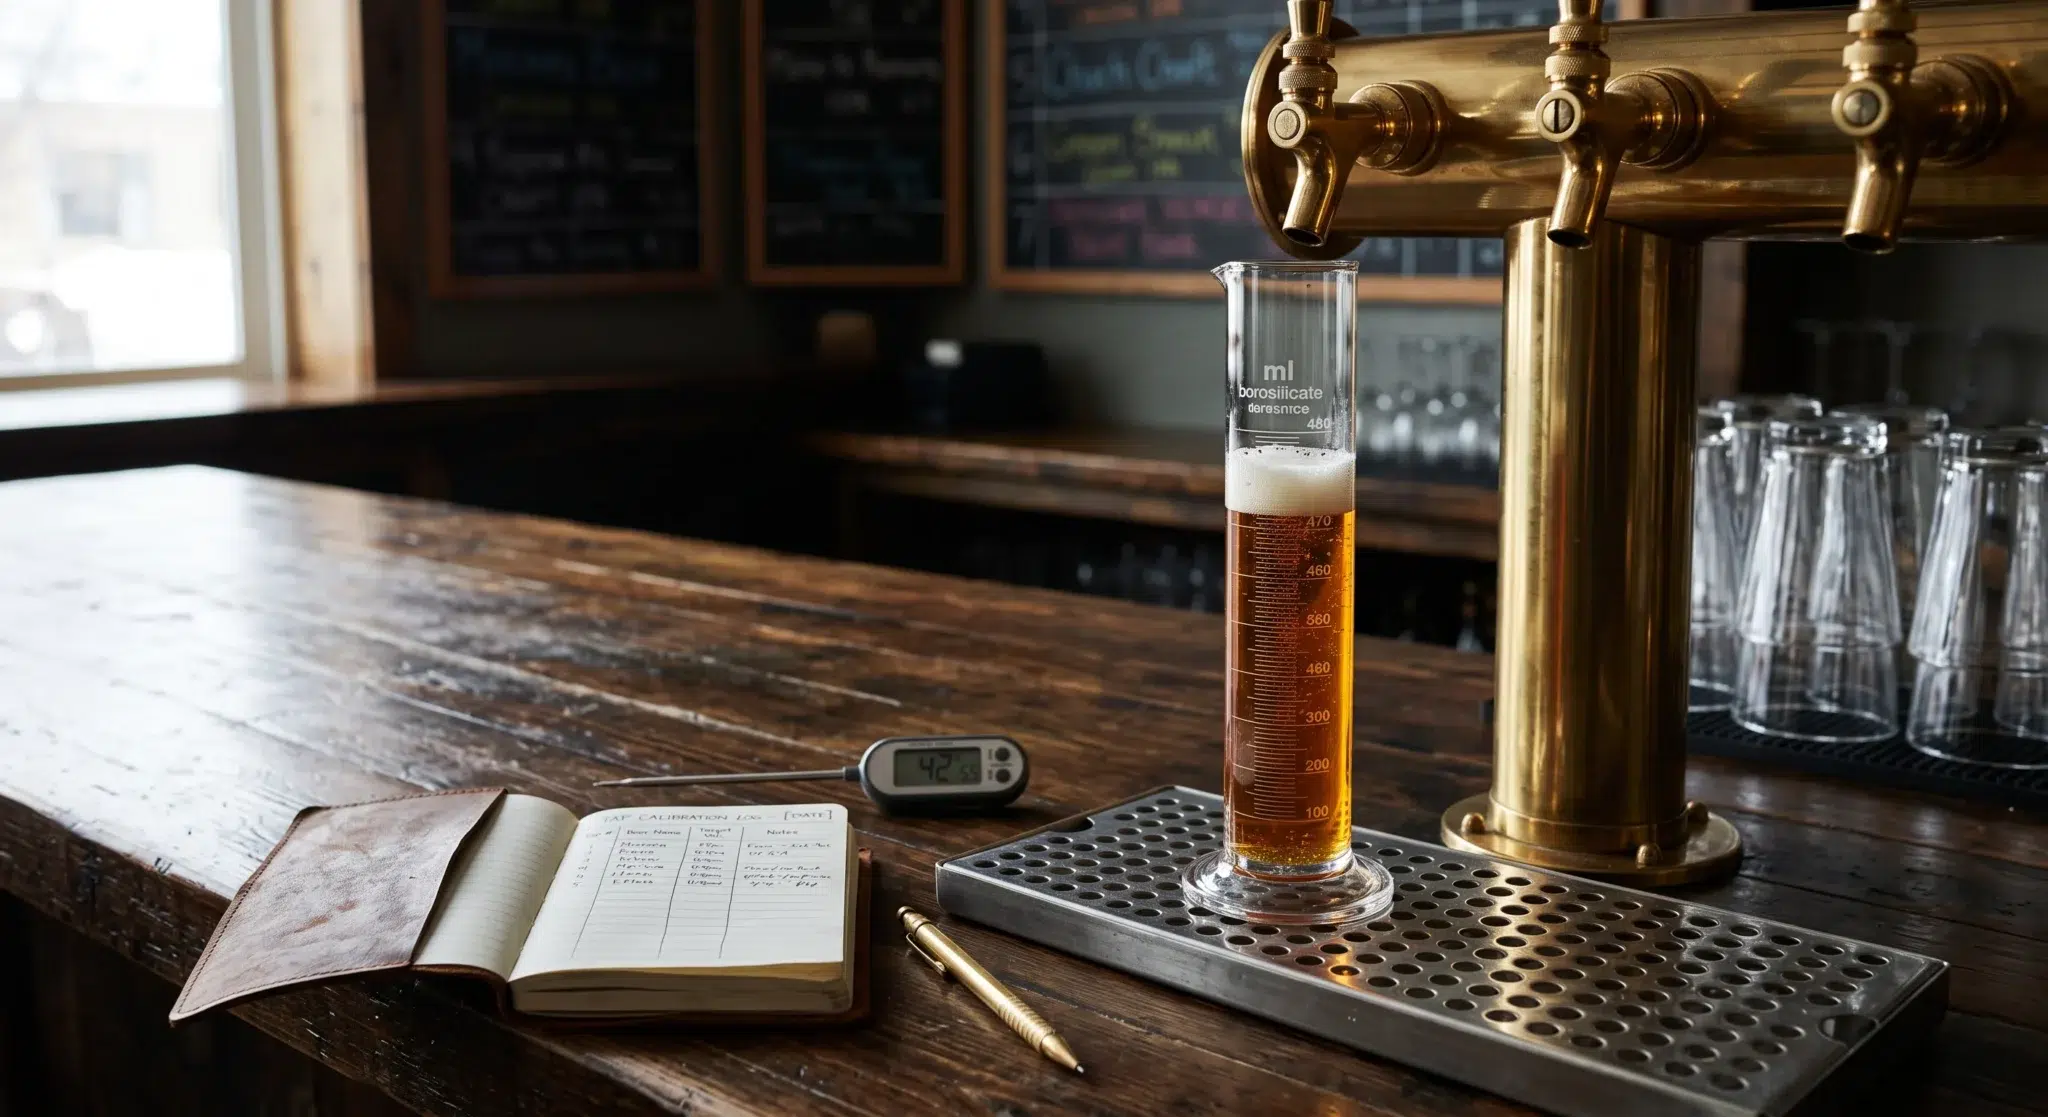
- Keg Storage Temperature: Maintain your walk-in cooler strictly between 36°F and 38°F (2.2°C to 3.3°C). If the liquid temperature rises to 42°F, dissolved carbon dioxide breaks out of the liquid, creating instant foam at the faucet.
- Glycol Bath Calibration: For long-draw draft systems, ensure your power pack glycol chiller runs between 28°F and 32°F (-2.2°C to 0°C). Warm trunk lines cause beer to heat up in transit between the cooler and the bar.
- Applied Gas Pressure (PSI): Set regulator pressure between 12 and 14 PSI for standard CO2 lines at sea level. For blended gas systems (70% CO2 / 30% Nitrogen), set primary regulators between 20 and 25 PSI to maintain carbonation without over-pressurizing the keg.
- Line Resistance Balance: Ensure that the physical resistance of your draft tubing (3/16-inch barrier tubing providing approximately 2.2 to 3.0 lbs of restriction per foot) perfectly matches the applied keg pressure. If resistance is too low, beer exits the faucet too fast, causing turbulent breakout foam.
Foam-on-Beer (FOB) Detectors and Line-Cleaning Waste Protocols
When a keg blows in the middle of a busy shift, gas rushes through the trunk line, spraying foam out the faucet. The bartender must tap a new keg and bleed several pints of foam from the line before serving clear beer again.
Installing modern hardware safeguards prevents this unnecessary waste:
- Foam-on-Beer (FOB) Detectors: Install mechanical FOB devices on every tap line in your walk-in cooler. When a keg empties, the FOB chamber drops an internal float that seals the line instantly. The draft line remains completely full of pressurized beer, allowing the new keg to pour clear beer immediately with zero line bleeding.
- Standardized Line Cleaning Flushes: Professional draft lines must be cleaned every two weeks with a 2% to 3% caustic solution. When cleaning lines, measure the volume of beer trapped in the trunk lines. A 100-foot run of 3/8-inch trunk line holds roughly 0.5 gallons (64 oz) of beer. Log this volume as formal maintenance waste in your POS system rather than treating it as unexplained shrinkage.
Behavioral Causes of Draft Shrinkage Behind the Pine
Once mechanical draft stability is established, management attention must turn to service execution behind the pine. In high-volume nightlife environments, operational habits and lack of portioning discipline create continuous inventory leakage.
Addressing these floor-level behaviors transforms your staff into professional beverage cost stewards and protects draft margins.
Free-Pouring, Over-Topping, and Unmeasured Pitcher Fills
Pouring draft beer is a craft that requires proper physical technique:
- The 45-Degree Pour Angle: Bartenders must hold the glass at a 45-degree angle one inch below the spout, opening the faucet with a swift, complete pull. Opening the faucet halfway restricts the valve, creating immediate turbulence and foam.
- The Drip-Tray Dumping Habit: Untrained staff often open the faucet over the drip tray to let initial foam run off before sliding the glass under the stream. This habit wastes two to three ounces of beer on every single pour.
- Over-Topping and Foam Scraping: Filling a pint glass completely to the brim with liquid beer dispenses seventeen to eighteen ounces into a 16-ounce glass. A proper pour leaves a 1-inch foam head (the collar), which contains volatile aroma compounds while preserving one to two ounces of liquid beer per serving.
- Pitcher Portioning Errors: Standard 60-ounce pitchers are frequently filled with sixty-four ounces of beer, giving away four extra ounces on every pitcher order without charging the customer.
Unrecorded Comps, “Spill” Exploitation, and Bartender Sweethearting
Internal shrinkage remains a major challenge in hospitality. When staff are not held accountable through itemized pour tracking, draft beer becomes an informal currency:
- The “Free Sample” Trap: Bartenders offer curious customers two-ounce taster pours. While sampling drives sales, pouring five unrecorded samples per hour drains over thirty ounces of premium craft beer every shift.
- Sweethearting and Unauthorized Comps: Bartenders pour beers for friends, regulars, or high-tipping patrons without ringing the items into the POS, effectively trading your inventory for personal tips.
- Spill Sheet Manipulation: When staff make pouring errors, they frequently discard the beer without logging the loss on the POS waste screen, masking operational mistakes as inventory errors.
Flow-Meter Telemetry: Capturing Pulse Dispense Data at the Shank
The most powerful technological weapon against draft shrinkage is real-time flow metering. Instead of guessing how much beer left a keg, modern draft monitoring systems place precision digital flow sensors directly onto your beer lines.
These flow meters capture exact dispense telemetry down to fractional milliliters, transforming draft beer into an audited, trackable asset.
Turbine Impellers and Ultrasonic Liquid Metering
Modern draft flow meters operate using two primary sensor technologies installed behind the tap tower or inside the walk-in cooler:
- Food-Grade Turbine Flow Meters: A miniature food-grade plastic impeller turbine sits inside the liquid stream. As beer passes through the sensor, the turbine spins, generating electromagnetic pulses (typically 2,200 pulses per liter). A micro-controller counts these pulses and converts them into exact fluid ounces with 99.5% accuracy.
- Ultrasonic Flow Sensors: Advanced non-invasive ultrasonic sensors measure fluid velocity using high-frequency sound waves transmitted through the outside of the draft line. Ultrasonic sensors create zero internal resistance and eliminate mechanical moving parts that require maintenance.
These sensors are food-safe, NSF-certified, and easily cleaned during routine bi-weekly chemical draft line flushes.
Real-Time IoT Telemetry and Faucet Open/Close Timestamps
Every time a tap handle is pulled, the connected flow-meter hub captures a complete data event:
- Timestamp Initiation: The sensor logs the exact second the faucet opens (e.g., 21:14:02).
- Volume Accumulation: The sensor streams continuous ounce counts as beer flows through the line.
- Pour Completion: The sensor logs the exact second the faucet closes (e.g., 21:14:07) and records total volume dispensed (e.g., 15.2 oz).
- Cloud Transmission: The flow-meter hub transmits this dispense record via local Wi-Fi or Ethernet to your point-of-sale cloud server within 500 milliseconds.
Reconciling Flow-Meter Telemetry with POS Pour Reports
Capturing dispense data is only half the solution; that flow data must be reconciled against commercial sales transactions. By matching physical ounces poured against electronic ring-ups, bar managers can identify the exact time, station, and employee associated with beverage variance.
Conducting daily shift reconciliations eliminates the mystery surrounding draft beer loss.
Calculating Shift-Level Pour Cost Variance
To audit draft performance, management calculates the Pour Variance Percentage at the conclusion of every shift:
Shift Draft Variance (%) = ((Total Ounces Dispensed via Flow Meters – Total Ounces Rung on POS) / Total Ounces Dispensed) * 100
Reviewing a real-world scenario highlights how variance auditing pinpoints shrinkage:
- IPA Tap Line (Friday Night Shift: 5:00 PM – 2:00 AM):
- Flow-Meter Dispense Total: 1,850 fluid ounces poured.
- POS Sales Ring-Ups: 102 Pints (at 14.5 oz liquid recipe standard) = 1,479 ounces accounted for.
- Logged Spillage & Samples: 45 ounces logged on POS waste screen.
- Total Accounted Volume: 1,524 fluid ounces.
- Unaccounted Shrinkage: 326 fluid ounces (21.4% Loss / ~22 Missing Pints).
In this scenario, over twenty-two pints of premium IPA disappeared without payment or waste logging during a single shift. Because the flow-meter data includes exact timestamps, the manager can cross-reference the 326-ounce discrepancy against security camera footage and employee login schedules to identify the exact cause.
Setting Acceptable Loss Baselines and Shift Accountability
Every bar operation must establish a clear, standardized variance threshold:
- Target Variance (< 5.0% Loss): World-class draft efficiency achieved through balanced lines, FOB detectors, and disciplined pouring.
- Acceptable Variance (5.0% – 8.0% Loss): Normal operational variance accounting for minor foam adjustments and customer taste tests.
- Investigation Threshold (> 8.1% Loss): Triggers an immediate mechanical line audit for temperature and pressure issues, followed by an operational review of bartender ring-up compliance.
Side-by-Side Comparison
| Operational Dimension | Unmonitored Draft Lines | Flow-Meter & POS Audited System (Biyo POS) |
|---|---|---|
| Average Keg Yield | 75% – 80% (93 to 99 pints per half-barrel) | 95% – 98% (118 to 122 pints per half-barrel) |
| Draft Pour Cost (COGS) | 22% to 28% of gross sales | 14% to 17% of gross sales |
| Shrinkage Visibility | Invisible; discovered monthly on P&L statements | Real-time shift alerts with exact timestamps |
| Foam Waste Management | Ignored; dumped down drip trays continuously | Pinpointed to specific mechanical line imbalance |
| Unrecorded Comps & Theft | Untracked; high risk of bartender sweethearting | Eliminated; every poured ounce requires a POS ring |
| Sample & Taster Tracking | Poured freely without documentation | Logged automatically via 1-tap taster buttons |
| FOB Line Protection | Lines blow empty, requiring massive foam purges | Lines remain charged for instant, clear pouring |
| Annual Profit Recovery | $0.00 (Standard continuous margin drain) | $12,000 to $35,000+ recovered per 20 tap lines |
How Biyo POS Automates Draft Yield Auditing and Variance Tracking
 How Biyo POS Automates Draft Yield Auditing and Variance Tracking
Biyo POS delivers a specialized cloud point-of-sale and beverage management platform engineered specifically to handle the complex inventory demands of high-volume bars, craft breweries, and nightlife venues. Operating natively inside the Google Chrome browser on any PC, Mac, iPad, or Android tablet, Biyo provides enterprise-grade beverage auditing without forcing operators into expensive proprietary hardware contracts.
With Biyo’s advanced beverage inventory module, learning how to track draft beer yield is fast and intuitive. The platform cross-references poured ounces captured by IoT flow-meter hardware directly against registered POS transactions in real time. Managers can view live variance heat maps that display exact pour-to-ring ratios across every individual tap line and shift. If a tap line dispenses beer without a corresponding POS transaction, Biyo logs an automated discrepancy event, alerting management immediately via email and the Biyo owner dashboard.
Furthermore, Biyo connects your front-of-house bar registers directly with back-of-house storage operations. Route complex food and drink tickets to kitchen prep lines via the Biyo Kitchen Display (KDS) app available on Google Play, conduct rapid keg and bottle stock audits using the Biyo Inventory Scanner app on the Apple App Store, and consolidate multi-room bar sales through Kitchen Hub. With Biyo’s true offline transaction mode, your bar registers continue ringing up drinks, opening tabs, and tracking sales timestamps even during complete internet outages.
To discover how easily your venue can eliminate draft beer shrinkage, audit keg yields, and protect beverage profit margins, you can schedule a live demo with a beverage systems specialist or create your account today on the Biyo signup page.
Frequently Asked Questions
How do you track draft beer yield in a commercial bar?
To track draft beer yield, bar operators install digital flow meters on draft lines to measure physical ounces dispensed, then cross-reference that volume against registered point-of-sale ring-ups to calculate shift variance and identify shrinkage.
How many 16-ounce pints are in a standard half-barrel keg?
A standard half-barrel keg contains 15.5 gallons (1,984 fluid ounces), which yields exactly 124 theoretical 16-ounce pints, or approximately 136 servings when poured with a standard 1.5-ounce foam collar.
What is an acceptable draft beer loss percentage?
In a well-balanced draft system with flow monitoring, an acceptable draft beer loss rate is between 4% and 7%, whereas unmonitored bars routinely suffer from 20% to 25% waste.
What causes draft beer to pour excessively foamy?
Excessive draft foam is primarily caused by warm keg temperatures (above 38°F), warm glycol chiller lines, incorrect CO2 regulator pressure (below 12 PSI or above 15 PSI), or unbalanced draft line restriction.
What is a Foam-on-Beer (FOB) detector?
A Foam-on-Beer (FOB) detector is a mechanical device installed on a draft line that seals the line instantly when a keg empties, keeping the line full of beer and eliminating the need to bleed foam when tapping a fresh keg.
How does Biyo POS identify draft beer shrinkage?
Biyo POS automatically compares timestamped dispense volume data from draft flow meters against registered sales rings, generating shift variance reports that pinpoint missing ounces by tap line, time, and employee ID.