
Managing a specialty cafe requires razor-sharp attention to margins, but mastering coffee shop recipe costing is what separates thriving coffee businesses from those operating at a quiet loss. When reviewing monthly financial statements, cafe owners are frequently shocked to discover that while top-line sales hit record highs, gross margins remain unexpectedly low. In many independent coffee shops, prime beverage costs quietly fluctuate between eighteen and thirty-five percent without explanation. The root cause is almost never wholesale ingredient price spikes; rather, it is the invisible, unmetered waste occurring at the espresso bar during every shift.
Unfortunately, traditional food service inventory systems track stock only in bulk commercial units like cases, gallons, and five-pound bags of coffee beans. When a customer orders a sixteen-ounce iced vanilla oat latte, conventional point of sale software simply records the sale of a finished drink. The software fails to deduct the eighteen grams of freshly ground single-origin espresso, the ten fluid ounces of barista oat milk, or the one and a half fluid ounces of Madagascar vanilla syrup used to prepare the beverage. Consequently, cafe owners cannot track whether baristas are pouring accurate portions, overfilling steaming pitchers, or dumping expensive plant milks down the drain.
However, controlling beverage pour costs does not require micromanaging your staff or weighing every cup during a chaotic morning commuter rush. By implementing real-time coffee shop recipe costing linked directly to fractional point of sale inventory deductions, you can monitor ingredient consumption down to the exact gram and fluid ounce. Modern cloud POS platforms automatically translate every register button tap into automated ingredient depletions, comparing theoretical usage against physical stock in real time. This comprehensive masterclass breaks down the mathematics of recipe costing, provides exact pour-cost formulas, and demonstrates how automated depletion tracking safeguards your cafe profits.
Table of Contents
- The Invisible Drain: Why Bulk Unit Inventory Tracking Fails Cafes
- The Mathematics of Coffee Shop Recipe Costing and Pour Costs
- Sub-Recipe Inventory Architecture: Mapping Register Keys to Raw Materials
- Spotting Barista Over-Portioning, Tare Math, and Steaming Waste
- Managing Spoilage, Cold Storage Variances, and Shift Waste Logs
- Theoretical vs. Actual Usage: Conducting Precision Variance Audits
- 5-Step Blueprint to Implement Coffee Shop Recipe Costing
- Side-by-Side Comparison
- How Biyo POS Automates Coffee Shop Recipe Costing and Stock Depletion
- Frequently Asked Questions
The Invisible Drain: Why Bulk Unit Inventory Tracking Fails Cafes
Many coffee shop owners treat inventory management as a weekly box-counting chore. On Sunday evening, a manager walks through the walk-in cooler and dry storage area with a clipboard, counting remaining gallons of whole milk, cartons of oat milk, and unopened bags of espresso beans.
While this basic method provides a high-level picture of total stock on hand, it creates a massive operational blind spot. Bulk counting completely fails to explain *why* inventory disappeared or *where* profit margins were lost throughout the week.
The Bulk Purchasing vs. Fractional Consumption Disconnect
The fundamental challenge of coffee shop operations lies in the disconnect between purchasing units and sales units:
- Wholesale Purchasing: You purchase whole-bean coffee in 5-pound (2,268 gram) bulk bags, dairy milk in 1-gallon (128 fluid ounce) jugs, alternative milks in 32-ounce aseptic cartons, and flavor syrups in 750-milliliter (25.4 fluid ounce) glass bottles.
- Retail Consumption: You sell finished drinks in precise, fractional micro-portions—an 18-gram espresso dose, 10 ounces of steamed milk, 0.5 ounces of flavor syrup, and a single paper takeaway cup with a plastic lid.
When your inventory software only records sales at the parent drink level, the system has no visibility into raw ingredient consumption. If your team sells 400 lattes in a week, you know how much gross revenue was collected, but you cannot verify whether your baristas consumed 30 gallons of dairy milk or 42 gallons to fulfill those orders.
Barista Free-Pouring and the Compounding Dairy Tax
Dairy and plant-based alternative milks represent the single largest variable expense in specialty coffee after direct labor. Specialty barista-grade oat milk routinely costs between $4.50 and $5.50 per 32-ounce carton, making it three to four times more expensive per ounce than conventional whole milk.
When baristas are rushed during peak morning hours, they frequently free-pour milk into steaming pitchers without referencing internal measurement lines. If a line cook overfills a steaming pitcher by just two ounces per drink to ensure a silky microfoam roll, that unused steamed milk cannot be reheated and is dumped into the sink. In a busy cafe processing 300 milk-based drinks daily, pouring just two excess ounces per drink wastes over 4.5 gallons of milk every day. Over a single year, that invisible dairy waste drains more than $6,500 in pure profit.
Grinder Dialing-In Waste, Purging, and Espresso Bean Loss
Espresso is a living agricultural product that reacts continuously to ambient room temperature, humidity, and barometric pressure. Professional baristas must “dial in” commercial espresso grinders multiple times each day by adjusting burr collar micrometers and running test shots.
During morning calibration, baristas routinely purge and discard four to six double doses of coffee. Throughout the shift, grinders retain ground coffee in the chute, requiring brief purge cycles between orders. If grinder retention, test shots, and spillage are left untracked, a cafe can easily burn through ten to fifteen percent of its premium roasted coffee beans before a single paid shot is pulled for a customer.
The Mathematics of Coffee Shop Recipe Costing and Pour Costs
To establish absolute control over food and beverage expenses, operators must calculate the exact cost of goods sold (COGS) for every menu item down to fractional pennies.
Deploying accurate coffee shop recipe costing formulas allows you to establish data-driven retail pricing, protect gross margins, and eliminate guesswork.
Deconstructing the Anatomy of a Specialty Latte
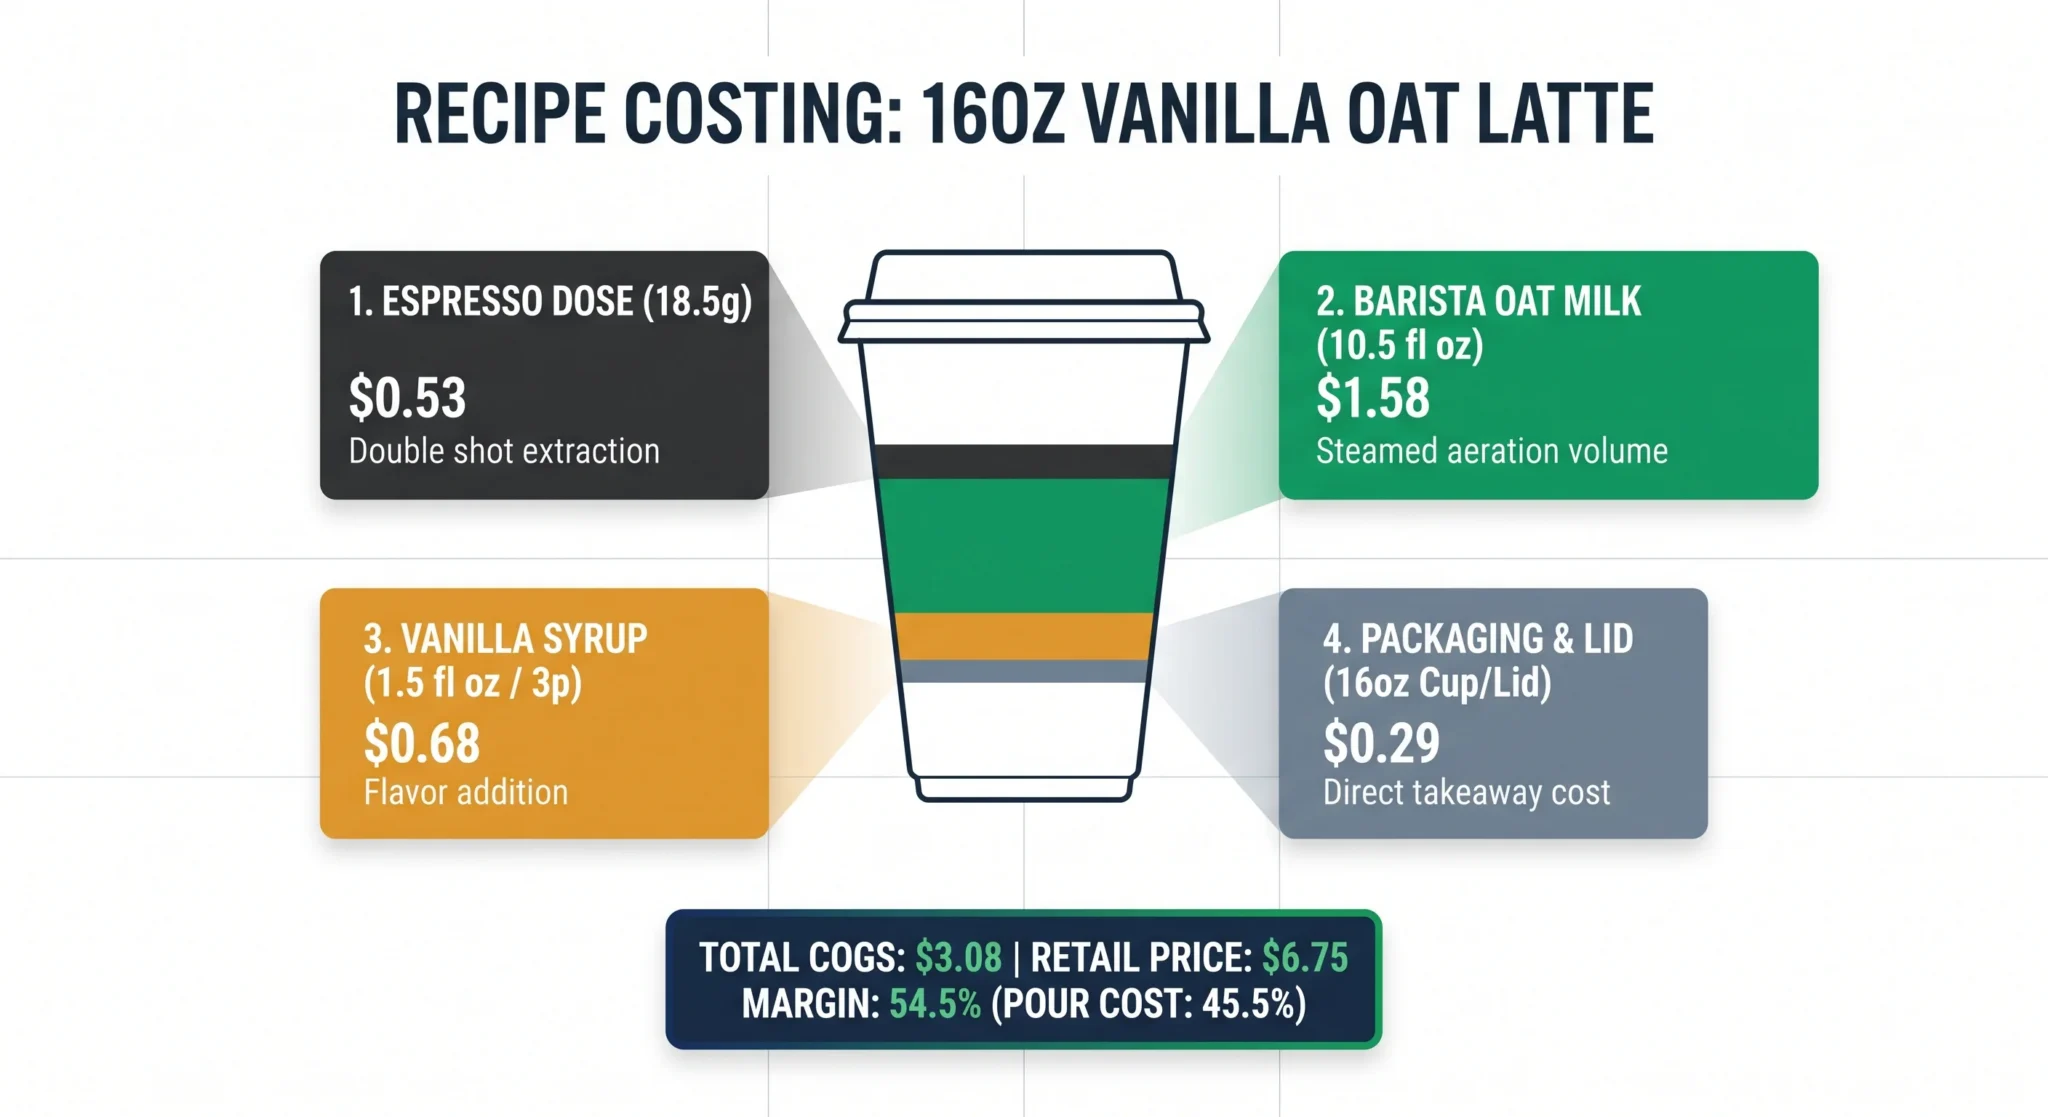
Consider the true component-level build of a standard 16-ounce Hot Vanilla Oat Latte served in a takeaway paper cup:
- Espresso Dose (Double Shot): 18.5 grams of specialty roasted espresso beans.
- Plant Milk: 10.5 fluid ounces of barista oat milk (accounting for steam aeration expansion).
- Flavor Syrup: 1.5 fluid ounces (3 standard 0.5-ounce barista pumps) of vanilla syrup.
- Paper Packaging: One 16-ounce insulated paper hot cup, one recyclable sipping lid, and one kraft paper sleeve.
Every physical element of this beverage carries a measurable wholesale unit cost that must be aggregated into your recipe costing matrix.
Calculating the Dry Gram Cost of Espresso
To calculate the precise cost of a double espresso shot, you must convert wholesale bulk weight into individual dry grams:
- Wholesale Cost: A 5-pound bulk bag of specialty roasted espresso beans costs $65.00 from your local roasting partner.
- Gram Conversion: One pound equals 453.592 grams. Therefore, a 5-pound bag contains: 5 * 453.592 = 2,267.96 grams.
- Cost Per Dry Gram: Divide the total bag cost by total grams: $65.00 / 2,267.96g = $0.02866 per gram.
- Double Shot Dose (18.5g): Multiply the gram cost by your recipe dose: 18.5g * $0.02866 = $0.530 per double shot.
If your barista accidentally overdoses the portafilter basket to 21.5 grams per shot (a common error when dosing by sight rather than using a tared digital scale), the espresso cost rises to $0.616 per shot. Across 10,000 monthly espresso drinks, that minor 3-gram over-portioning error wastes over $860 per month in raw roasted coffee beans.
Liquid Ounce Modeling for Milk Steaming and Pitcher Waste
Liquid dairy and plant milk calculations must factor in both the beverage cup volume and mandatory pitcher prep buffers:
- Wholesale Milk Cost: A 32-fluid-ounce carton of barista oat milk costs $4.80 wholesale.
- Cost Per Fluid Ounce: Divide carton cost by total volume: $4.80 / 32 fl oz = $0.150 per fluid ounce.
- Recipe Steaming Dose (10.5 fl oz): Multiply ounce cost by required steaming volume: 10.5 oz * $0.150 = $1.575 for oat milk.
In contrast, a gallon of standard whole dairy milk costs $3.80 wholesale ($0.0297 per fluid ounce). Steaming 10.5 ounces of whole milk costs just $0.312. This stark price difference illustrates why cafes must charge an upcharge (typically $0.75 to $0.90) for plant milk modifications to protect their beverage margins.
Fractional Syrup Pump Calculations and Packaging Costs
Gourmet flavor syrups and paper packaging materials represent substantial ongoing expenses:
- Syrup Pump Cost: A 750ml (25.36 fl oz) bottle of Madagascar vanilla syrup costs $11.50. One fluid ounce costs $0.453. A standard 3-pump dose (1.5 fl oz) costs exactly $0.680.
- Paper Packaging Stack: Custom printed 16oz hot cup ($0.18) + compostable lid ($0.07) + kraft sleeve ($0.04) = $0.290 per drink.
Aggregating all sub-components yields the total Cost of Goods Sold for the 16oz Vanilla Oat Latte:
- Espresso Dose (18.5g): $0.530
- Barista Oat Milk (10.5 oz): $1.575
- Vanilla Syrup (1.5 oz): $0.680
- Packaging & Lid: $0.290
- Total True Drink Cost: $3.075
If your cafe retails this specialty beverage for $6.75, your actual pour cost is **45.5%**. However, if the customer orders the same drink with standard whole milk ($0.312 milk cost), the total drink cost drops to $1.812, delivering an exceptional **26.8%** pour cost. Understanding these granular figures through coffee shop recipe costing allows operators to optimize modifier upcharges accurately.
Sub-Recipe Inventory Architecture: Mapping Register Keys to Raw Materials
Achieving automated inventory tracking requires structuring your point of sale catalog around a relational database model known as a Bill of Materials (BOM). Instead of treating menu items as flat SKUs, modern cloud POS platforms utilize multi-tiered sub-recipe mapping.
This architectural framework connects front-of-house register buttons directly to back-of-house raw ingredient reserves.
The 3-Tier Catalog Hierarchy
A robust sub-recipe inventory system operates across three distinct structural tiers:
- Tier 1: Master Raw Ingredients (The Pantry): Represents bulk inventory items purchased from vendors (e.g., “Whole Bean House Blend”, “Whole Milk Gallon”, “Oat Milk 32oz Carton”, “Vanilla Syrup 750ml Bottle”, “16oz Hot Cups”). Each raw ingredient is tracked in base standard units (grams, fluid ounces, or each).
- Tier 2: Prepared Sub-Recipes (Batch Prep): Represents in-house batch creations prepared by kitchen staff (e.g., “Cold Brew Concentrate 5-Gallon Keg”, “House-Made Simple Syrup 2-Liter Batch”, “Chai Tea Concentrate”). The system tracks the raw ingredients consumed to create the batch and establishes a yielded unit cost per ounce.
- Tier 3: Finished POS Menu Items (Sales Triggers): Represents the customer-facing buttons on the cash register (e.g., “16oz Iced Latte”). Each menu item is mapped to a dynamic recipe formula linking Tier 1 and Tier 2 ingredients.
Dynamic Modifier Decrementing
The true power of sub-recipe architecture appears during menu customization. When a customer modifies their drink at checkout, the POS dynamically recalculates ingredient deductions:
- Parent Item Tap (“16oz Latte”): Queues base deduction of 18.5g espresso beans, 10.5oz whole milk, and 16oz paper cup.
- Modifier Substitution (“Sub Oat Milk”): The software cancels the 10.5oz whole milk deduction and instantly substitutes a 10.5oz deduction from the active oat milk inventory pool.
- Modifier Addition (“Add 2 Pumps Caramel”): The software appends a 1.0oz deduction to the caramel syrup inventory pool and applies the pre-set retail upcharge.
- Espresso Modification (“Add Extra Shot”): The software appends a 9.25g single-dose deduction to the espresso bean pool.
When the cashier finalizes the transaction, the POS cloud server decrements all associated raw ingredient balances simultaneously across your centralized database in milliseconds.
Spotting Barista Over-Portioning, Tare Math, and Steaming Waste
Deploying recipe-level inventory tracking provides cafe owners with complete operational visibility. When theoretical inventory usage is calculated automatically from sales data, management can easily identify physical over-portioning and barista technique inconsistencies.
Addressing these floor-level habits transforms your staff from unmonitored pourers into precise culinary professionals.
Enforcing Gravimetric Dosing Over Timed Grinding
Many specialty coffee shops rely on timed electronic grinders, setting the grinder timer to 4.2 seconds to yield an 18-gram dose. However, as the bean hopper empties, the downward weight pressure on the grinder burrs decreases, altering bean feed rates.
In addition, as grinder burrs heat up during morning rushes, grind particle distribution shifts, causing timed doses to fluctuate by as much as two to three grams per shot.
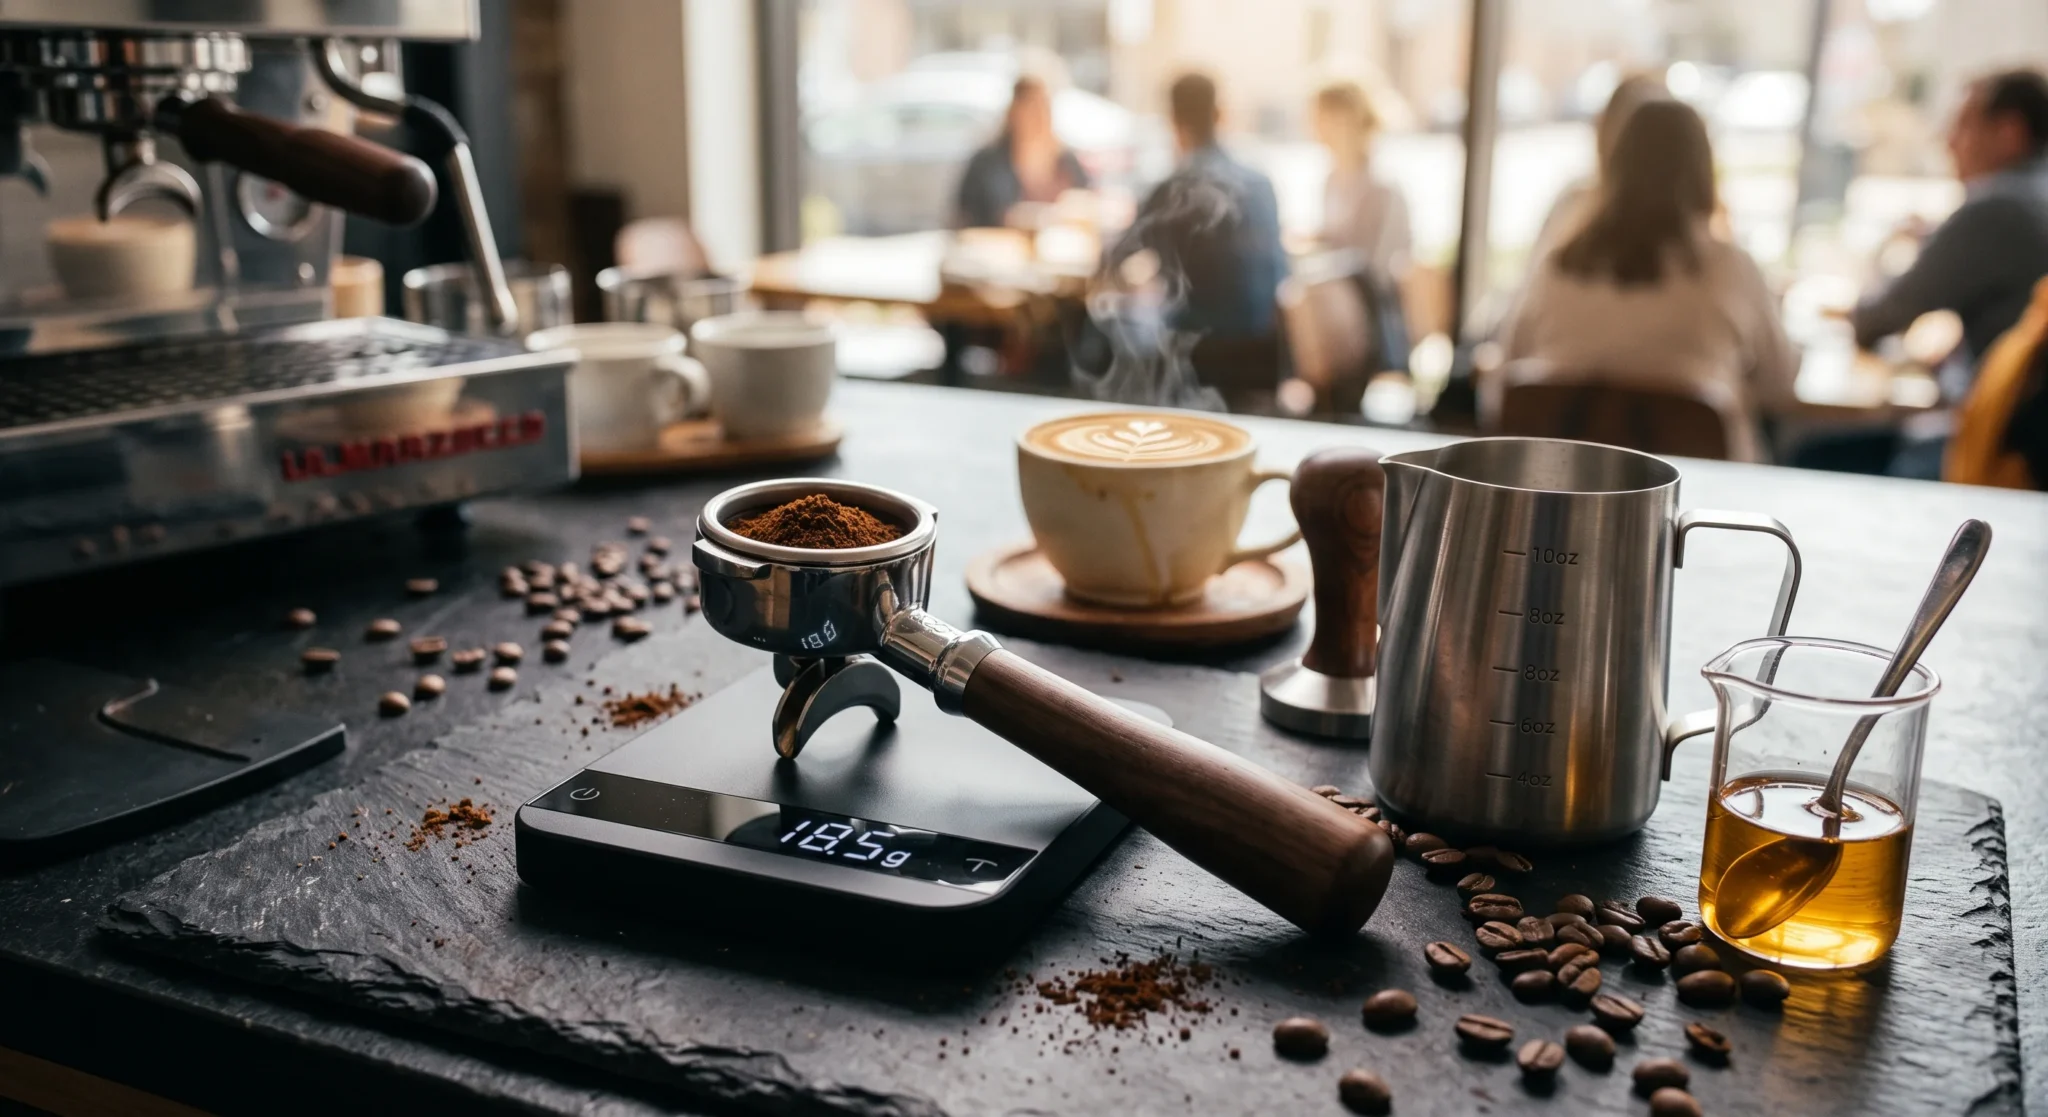
Cafe operators must enforce gravimetric dosing—weighing the dry grounds inside the portafilter using a fast-response digital scale before every extraction:
- Place the empty portafilter on the scale and press **Tare** to zero the display.
- Grind espresso into the basket.
- Place the loaded portafilter back on the scale to verify exact target dry weight (e.g., 18.5g ± 0.2g).
- Adjust or sweep excess grounds before tamping and locking into the espresso machine group head.
Pitcher Etching and Volumetric Milk Control
The primary cause of dairy waste is the lack of visual guide lines inside standard stainless steel steaming pitchers. Baristas often eyeball milk volume by filling the pitcher to the bottom of the spout indentation, which routinely results in three to four ounces of excess milk.
Operators should invest in commercial steaming pitchers featuring internal laser-etched fluid ounce measurement lines:
- 12oz Beverage: Pour cold milk to the exact 8-ounce internal etching. Aeration will expand volume to 10 ounces, leaving less than 0.5 ounces of residual milk after pouring.
- 16oz Beverage: Pour cold milk to the exact 10.5-ounce internal etching.
- Split-Pitcher Steaming Protocols: Train baristas to steam milk for two identical drinks in a single large pitcher during rushes rather than steaming two separate half-filled pitchers, cutting cycle times and dairy waste in half.
Managing Spoilage, Cold Storage Variances, and Shift Waste Logs
In any food service operation handling fresh dairy, roasted coffee, and house-made syrups, a portion of inventory will inevitably be lost to spoilage, equipment maintenance, and expiration.
Managing waste effectively requires establishing a clear operational distinction between accounted operational waste and unrecorded inventory shrinkage.
Managing the Perishable Dairy Lifecycle (FIFO Protocols)
Dairy milk and opened plant milk cartons possess strict refrigerated shelf lives. To prevent spoilage losses:
- First-In, First-Out (FIFO) Rotation: Ensure all incoming milk crates are loaded from the back of the walk-in cooler, pushing older cartons to the front for immediate consumption.
- Open-Carton Dating: Require baristas to write the open date on all plant milk cartons using a waterproof marker upon breaking the factory seal. Any opened carton exceeding seven days must be discarded.
- Walk-In Temperature Telemetry: Maintain commercial refrigeration temperatures strictly between 34°F and 38°F (1.1°C to 3.3°C). A temperature spike to 42°F can cut fresh whole milk shelf life in half, causing premature souring and curdling.
Digital Shift Waste Logging at the POS Terminal
Never allow baristas to discard spoiled milk, scorched syrups, or purged espresso beans without logging the event. Modern cloud POS platforms include dedicated **Waste & Spoilage Tracking** modules directly on the register screen.
When a barista drops a gallon of whole milk or discards a batch of oxidized cold brew, they tap **Inventory Actions > Log Waste**, select the raw ingredient, input the discarded volume, and select a mandatory reason code (e.g., “Dropped/Spilled”, “Expired/Sour”, “Grinder Calibration Purge”, “Quality Control Rejection”). The software removes the volume from active stock, tags the expense to your general ledger spoilage account, and prevents unexplained variance discrepancies during weekly audits.
Theoretical vs. Actual Usage: Conducting Precision Variance Audits
The ultimate test of beverage margin control is the weekly variance audit. By comparing your theoretical ingredient consumption (what your POS calculates should have been used based on registered sales) against your actual physical inventory depletion (what is missing from your shelves), you can pinpoint financial leaks immediately.
Reviewing this mathematical variance allows management to take swift corrective action before minor portioning errors damage monthly profitability.
The Food Cost Variance Equation
Calculating inventory variance follows a straightforward three-step mathematical formula:
- Actual Consumption = (Starting Physical Stock + Received Shipments) – Ending Physical Stock
- Theoretical Consumption = Sum of all raw ingredients mapped to completed POS sales and logged waste
- Inventory Variance (%) = ((Actual Consumption – Theoretical Consumption) / Theoretical Consumption) * 100
Interpreting Variance Results
Reviewing a practical example highlights how variance analysis identifies operational problems:
- Scenario: Barista Oat Milk 32oz Cartons (Weekly Audit)
- Starting Stock: 40 cartons (1,280 fl oz)
- Received Deliveries: 100 cartons (3,200 fl oz)
- Ending Physical Count: 32 cartons (1,024 fl oz)
- Actual Consumption: 3,456 fl oz (108 cartons)
- POS Theoretical Sales Depletion: 280 drinks * 10.5 oz = 2,940 fl oz
- Logged Spillage / QC: 64 fl oz (2 cartons)
- Theoretical Consumption: 3,004 fl oz (93.88 cartons)
- Unaccounted Variance: -452 fl oz (-14.12 cartons / 15.0% Loss)
In this common scenario, the audit reveals that your cafe consumed 14 cartons of oat milk ($67.20 wholesale value) more than registered sales can account for in a single week. This 15% negative variance immediately alerts the general manager to investigate barista over-pouring, unrecorded drink giveaways, or missed register modifier upcharges.
 5-Step Blueprint to Implement Coffee Shop Recipe Costing
 5-Step Blueprint to Implement Coffee Shop Recipe Costing
Deploying recipe-level inventory management across your cafe is a structured process. By following this proven 5-step operational blueprint, managers can transition from vague bulk tracking to real-time fractional margin control smoothly.
Below is the step-by-step implementation guide to optimize your coffee shop recipe costing architecture.
Step 1: Standardize Core Drink Recipes and Yield Measurements
1. Convene a meeting with your head barista and shift supervisors to document exact, unyielding recipe cards for every drink on your menu.
2. Establish standard dry espresso doses in grams (e.g., Small/Med = 18.5g, Large = 21.0g).
3. Measure exact liquid milk pour lines for 12oz, 16oz, and 20oz hot and iced beverages using graduated measuring cylinders.
4. Calibrate all syrup pumps using a precision scale to verify that one full depression delivers exactly 0.5 fluid ounces (15ml) of syrup.
Step 2: Establish Master Unit of Measure Conversion Tables in POS
1. Open your cloud POS back-office dashboard inside your Google Chrome web browser.
2. Navigate to **Inventory Settings > Units of Measure (UOM)**.
3. Configure your universal conversion tables: Pounds to Grams (1 lb = 453.592g), Gallons to Fluid Ounces (1 gal = 128 fl oz), Liters to Fluid Ounces (1 L = 33.814 fl oz), and Bottles to Milliliters (750ml = 25.36 fl oz).
4. Standardizing these mathematical conversions ensures seamless depletion across diverse packaging formats.
Step 3: Map Component Bills of Materials to Register SKUs
1. Open **Catalog Management > Menu Items** and select your primary beverage buttons.
2. Link each parent drink to its component raw ingredients (e.g., link “16oz Iced Latte” to 18.5g Espresso Beans, 10.5oz Whole Milk, 16oz Clear Cup, 16oz Flat Lid, and 1 Straw).
3. Attach dynamic modifier groups to each drink, ensuring that alternative milks, syrup pumps, and extra shots trigger exact ingredient replacements and additions.
4. Input current wholesale supplier invoices to establish live base costs for every raw component.
Step 4: Calibrate Barista Workstations and Enforce Scale Protocols
1. Equip every espresso grinder station with a high-precision, water-resistant digital scale accurate to 0.1 grams.
2. Provide laser-etched steaming pitchers at every milk station and remove unmarked legacy pitchers from the bar pass.
3. Train all baristas on tare math, gravimetric portafilter dosing, and pitcher fill boundaries.
4. Conduct speed-accuracy drills during afternoon training sessions to build muscle memory around calibrated portioning.
Step 5: Launch Automated Depletion Audits and Variance Alerts
1. Enable automated low-stock reorder thresholds for high-velocity raw ingredients (espresso beans, whole milk, oat milk, vanilla syrup).
2. Establish a mandatory Sunday evening cycle count routine for high-cost pantry items using mobile scanning tools.
3. Program your cloud POS to generate weekly **Theoretical vs. Actual Variance Reports** delivered automatically to management email accounts.
4. Review variance trends weekly with shift leads to maintain accountability and celebrate food-cost optimization milestones.
Side-by-Side Comparison
| Inventory Dimension | Traditional Bulk Unit Tracking | Real-Time Recipe-Level Costing (Biyo POS) |
|---|---|---|
| Tracking Granularity | Whole cases, gallons, and 5lb bags only | Exact dry grams, fluid ounces, and pump counts |
| Depletion Trigger | End-of-week manual clipboard physical count | Instant real-time depletion on every register sale |
| Barista Over-Pour Detection | Invisible; hidden in general monthly food cost | Identified immediately via weekly variance audits |
| Modifier Upcharge Verification | Unenforced; cashiers forget milk upcharges | Automated recipe link captures upcharges & stock |
| Espresso Grinder Waste Tracking | Untracked; assumed 100% yield from bean bags | Separate tracking of calibration purges & QC doses |
| True Pour Cost Visibility | Vague estimates based on supplier invoices | Exact fractional penny COGS on every menu SKU |
| Cycle Count Duration | Hours of disruptive manual spreadsheet counting | 10-Minute rapid counts via mobile iOS scanner |
| Annual Shrinkage & Waste Impact | 5% to 12% margin loss from unmonitored waste | Recovers $5,000 to $15,000+ in annual gross profit |
How Biyo POS Automates Coffee Shop Recipe Costing and Stock Depletion
Biyo POS delivers a comprehensive cloud hospitality management platform engineered specifically to solve the complex fractional inventory challenges of specialty coffee shops, cafes, and bakeries. Running smoothly entirely in the cloud directly inside the Google Chrome web browser on any Mac, PC, iPad, or Android tablet, Biyo provides cafe owners with enterprise-grade recipe costing and inventory controls without expensive proprietary hardware lock-in.
With Biyo’s advanced **Sub-Recipe Inventory Module**, establishing precise coffee shop recipe costing takes only minutes. Build multi-component Bills of Materials linking customer-facing register buttons to fractional gram and ounce depletions in real time. When a customer orders a complex customized beverage, Biyo automatically decrements raw espresso beans, alternative milks, and syrup pumps from your live stock simultaneously. If actual ingredient usage deviates from theoretical sales depletions beyond your custom variance threshold, Biyo fires an instant alert directly to the centralized owner dashboard and manager email.
Furthermore, Biyo connects your back-of-house pantry with a unified front-of-house ecosystem. Baristas receive cleanly formatted, scannable order tickets on the **Biyo Kitchen Display (KDS) app available on Google Play**, while store managers can conduct rapid on-floor cycle counts and stock intake using the **Biyo Inventory Scanner app on the Apple App Store**. In addition, Biyo seamlessly integrates commission-free direct online orders via Kitchen Hub and ensures continuous checkout uptime during internet outages with its true offline local caching mode.
To discover how easily your cafe can eliminate milk waste, master recipe costing, and protect beverage profit margins, you can schedule a live demo with an onboarding specialist or create your account today on the Biyo signup page.
Frequently Asked Questions
What is coffee shop recipe costing?
Coffee shop recipe costing is the mathematical process of calculating the exact wholesale cost of every raw ingredient—including dry espresso grams, fluid ounces of milk, syrup pumps, and paper cups—used to prepare a specific beverage menu item.
Why is tracking liquid ounces and dry grams important in a cafe?
Tracking fractional grams and ounces allows cafe owners to calculate true beverage pour costs, identify barista over-portioning errors, catch unrecorded drink giveaways, and eliminate expensive dairy and plant milk waste.
How does Biyo POS track inventory when a drink is customized?
When a drink modifier is selected at checkout (such as substituting oat milk or adding vanilla pumps), Biyo dynamically swaps and appends the specific raw ingredient depletions in your cloud database the moment the sale is finalized.
How do you calculate the cost of a double espresso shot?
To calculate the cost of a double espresso shot, divide the total wholesale cost of your coffee bean bag by the total dry grams in the bag (e.g., $65.00 / 2,268g = $0.02866/g), then multiply that gram cost by your target dose weight (e.g., 18.5g * $0.02866 = $0.530).
What is the difference between theoretical and actual inventory usage?
Theoretical usage is the exact amount of ingredients your POS calculates should have been consumed based on registered sales formulas, while actual usage is the physical amount of stock depleted from your shelves between inventory cycle counts.
Can Biyo POS alert managers when milk or coffee waste is too high?
Yes. Biyo POS compares theoretical consumption against actual physical inventory counts, automatically generating variance reports and sending real-time email alerts to management when ingredient discrepancies exceed acceptable thresholds.