Retail businesses operate in an increasingly data-driven environment where performance measurement plays a central role in decision-making. However, while modern retail systems generate vast amounts of information, not all metrics contribute equally to business success. The concept of Retail Store KPIs That Actually Matter refers to the performance indicators that genuinely drive profitability, operational efficiency, and long-term growth.
Many retailers track dozens of retail KPIs every week. Yet, focusing on too many store performance metrics can create confusion rather than clarity. According to industry research, high-performing retail organizations typically concentrate on fewer than 10 core KPIs that directly influence profit, inventory efficiency, and customer value.
Retailers often prioritize revenue, traffic, and promotional activity. Meanwhile, they overlook powerful retail business metrics such as gross margin return on investment (GMROI), inventory turnover rate, and average transaction value. These metrics provide deeper insights into operational health and cash flow sustainability.
When retailers prioritize meaningful performance indicators, strategic decisions become clearer, teams align around measurable goals, and stores gain stronger control over profitability.
Table of Contents
- Why the Right KPIs Matter in Retail
- Profitability Metrics That Drive Results
- Inventory KPIs That Protect Cash Flow
- Sales and Customer Metrics That Support Growth
- Vanity Metrics Retailers Should Avoid
- Building a KPI Dashboard That Works
- How Biyo POS Helps Track Meaningful Retail KPIs
- FAQ
Why the Right KPIs Matter in Retail
Selecting the correct performance indicators fundamentally shapes how retailers manage their daily operations. While numerous store performance metrics may appear valuable on reports, only a select group truly contributes to sustainable profitability.
Retailers who prioritize the right metrics gain clearer insight into operational performance, customer behavior, and inventory health. This clarity enables faster decision-making and more strategic resource allocation.
According to retail analytics studies, companies that use structured KPI dashboards improve operational efficiency by up to 25% compared to organizations relying on fragmented reporting systems.
Too Many Metrics Create Confusion
Modern POS systems and analytics platforms provide access to enormous volumes of retail data. While this access can be powerful, tracking too many retail KPIs often creates distraction rather than actionable insight.
Managers who review excessive reports may struggle to identify what truly requires attention. Instead of measuring everything, retailers should concentrate on metrics that influence margin, inventory productivity, and customer lifetime value.
Clear KPI priorities also improve team accountability. When employees understand which metrics matter most, performance reviews become focused and constructive rather than overwhelming.
Understanding which numbers matter naturally leads to examining profitability metrics.
KPIs Must Align With Business Goals
Every retail organization operates with unique strategic objectives. Some businesses prioritize expanding store locations, while others aim to improve cash flow stability or increase profitability.
Therefore, the most important retail KPIs should align directly with these strategic goals.
For example:
- Businesses focused on cash flow prioritize inventory turnover rate.
- Retailers seeking revenue growth focus on average transaction value.
- Multi-location retailers track sales per square foot to evaluate store efficiency.
Alignment ensures that each KPI supports measurable outcomes and contributes to long-term success.
 Profitability Metrics That Drive Results
 Profitability Metrics That Drive Results
Profitability ultimately determines the success of any retail business. Revenue may attract attention, but margin-focused retail business metrics reveal deeper operational insights.
Gross Margin Return on Investment (GMROI)
Gross Margin Return on Investment (GMROI) measures how much profit a retailer generates for every dollar invested in inventory. It combines profit margin and inventory productivity into a single performance indicator.
For example, a GMROI of 3.0 means the retailer earns three dollars in gross profit for every dollar invested in inventory.
This metric helps retailers evaluate purchasing decisions and inventory mix. If GMROI declines, it may indicate that inventory is tying up capital without producing sufficient profit.
Retailers who track GMROI consistently can adjust product selection, pricing, and purchasing strategies before profitability suffers.
Gross Profit Margin
Gross profit margin represents the percentage of revenue remaining after subtracting the cost of goods sold (COGS). This KPI reveals how effectively a retailer manages pricing and supplier costs.
Even if sales increase, shrinking margins can erode profitability. Retailers should analyze margin performance by product category to identify underperforming items.
Maintaining stable gross margins strengthens resilience against price competition and market volatility.
Sales per Square Foot
Sales per square foot measures the revenue generated for each square foot of retail selling space. This metric is particularly important in shopping centers and urban retail locations where rent costs are high.
Retailers in the United States typically aim for sales per square foot above $300 annually, though this varies significantly by industry.
Optimizing product placement, store layout, and merchandising strategies can significantly improve this KPI.
Inventory KPIs That Protect Cash Flow
Inventory represents one of the largest financial investments in retail operations. Effective inventory management protects cash flow while reducing financial risk.
Inventory Turnover Rate
Inventory turnover rate measures how frequently stock sells and replenishes over a given period.
A higher turnover rate indicates strong demand and efficient inventory management. Conversely, slow turnover suggests overstocking or weak product performance.
Retail analysts often recommend inventory turnover ratios between 4 and 8 times per year, depending on the retail sector.
Retailers who monitor turnover closely can maintain optimal inventory levels while reducing markdown risk.
Stockout Rate
The stockout rate measures how frequently products are unavailable when customers attempt to purchase them.
High stockout rates result in lost sales and disappointed customers. Research shows that retailers can lose up to 10% of potential revenue due to stockouts.
Balancing safety stock levels with turnover goals ensures both availability and efficient capital usage.
Sales and Customer Metrics That Support Growth
Customer purchasing behavior directly influences retail revenue. Understanding how customers interact with products helps retailers improve growth strategies.
Average Transaction Value
Average transaction value (ATV) measures how much customers spend during each purchase.
Increasing ATV often involves upselling strategies, product bundling, and effective merchandising.
Even small improvements can significantly increase revenue. For example, raising ATV from $40 to $44 increases revenue by 10% without increasing customer traffic.
Customer Repeat Rate
The customer repeat rate measures how often shoppers return for additional purchases.
Acquiring new customers can cost five times more than retaining existing ones. Therefore, improving repeat purchase behavior is essential for sustainable growth.
Loyalty programs, personalized marketing, and excellent customer service can significantly increase repeat purchase rates.
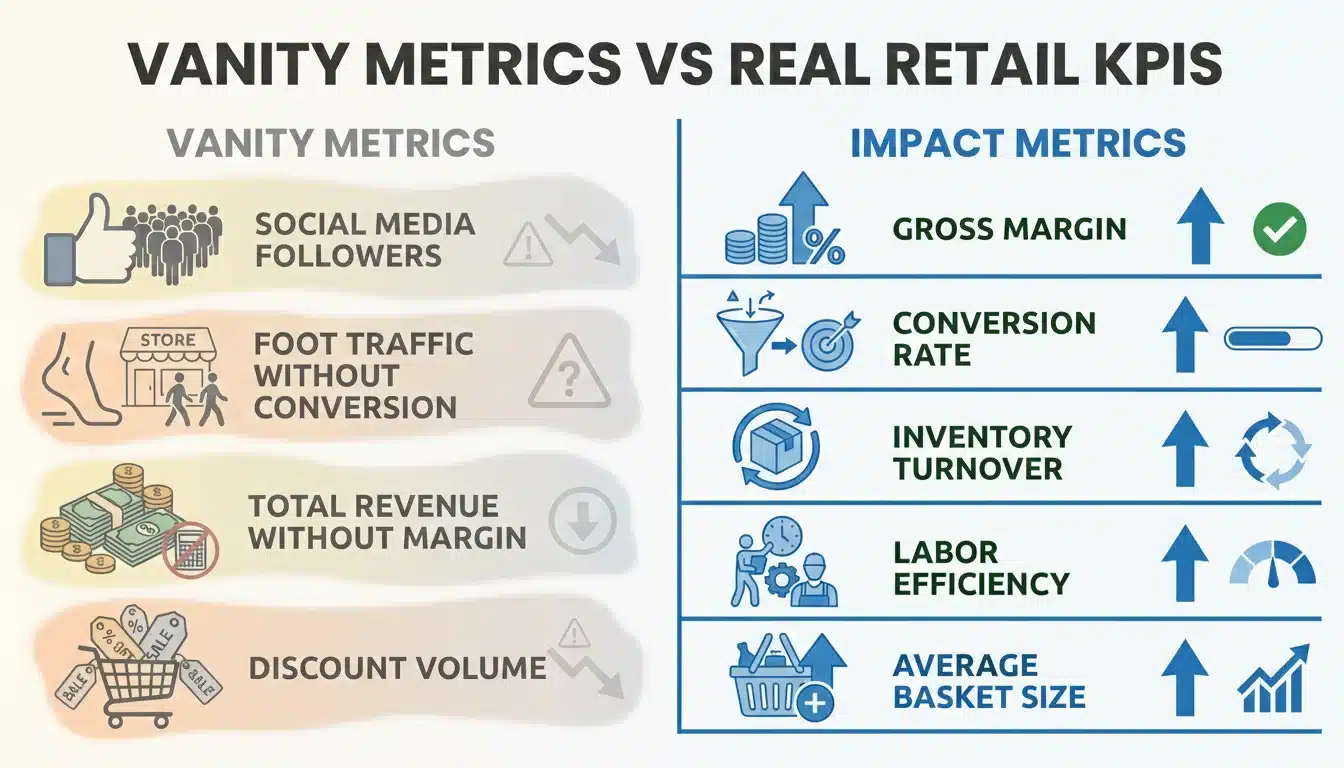
Vanity Metrics Retailers Should Avoid
Not all metrics contribute meaningfully to retail performance. Some numbers appear impressive but offer little strategic value.
Social Media Follower Count
Large social media followings may look impressive in reports. However, follower counts rarely correlate directly with revenue.
Instead of focusing on follower totals, retailers should measure engagement, conversion rates, and revenue generated through social media channels.
Foot Traffic Without Conversion Context
Foot traffic measures the number of visitors entering a store. However, traffic alone does not guarantee sales.
Conversion rate — the percentage of visitors who make purchases — provides a much clearer performance indicator.
Retailers often achieve stronger revenue growth by improving conversion rates rather than simply increasing traffic.
Building a KPI Dashboard That Works
A structured KPI dashboard transforms raw data into actionable insights.
Limit KPIs to Core Categories
Retail KPI dashboards should focus on three primary categories:
- Profitability metrics
- Inventory efficiency metrics
- Customer and sales performance metrics
Limiting dashboards to essential KPIs prevents data overload and improves focus.
Review Metrics Consistently
Different KPIs require different review frequencies.
- Sales and conversion metrics should be reviewed daily.
- Inventory performance should be reviewed weekly.
- Profitability metrics should be reviewed monthly.
Consistent monitoring allows retailers to detect performance issues early and respond quickly.
 How Biyo POS Helps Track Meaningful Retail KPIs
Tracking meaningful KPIs requires accurate data and easy-to-use reporting tools. Biyo POS provides retailers with real-time dashboards that highlight essential performance metrics without overwhelming store managers.
Because the platform integrates sales reporting, inventory management, and multi-location analytics into a single cloud-based system, retailers gain instant visibility into their operational performance.
Features such as margin reporting, inventory turnover tracking, and customer analytics help teams focus on metrics that directly support profitability and efficiency.
Retailers interested in gaining deeper insight into their store performance metrics can schedule a live demo to see how the platform simplifies KPI tracking and operational reporting.
Businesses ready to implement a modern retail management system can also explore the platform through the Biyo signup page to begin tracking meaningful retail KPIs immediately.
FAQ
What are the most important retail KPIs?
The most important retail KPIs include gross margin return on investment (GMROI), inventory turnover rate, sales per square foot, average transaction value, conversion rate, and customer repeat rate.
Why is inventory turnover important?
Inventory turnover indicates how efficiently products sell and replenish. Higher turnover improves cash flow and reduces the risk of excess inventory.
What are vanity metrics in retail?
Vanity metrics are numbers that appear impressive but do not directly influence profitability, such as social media follower counts without sales conversion.
How often should retail KPIs be reviewed?
Sales metrics should be reviewed daily, inventory performance weekly, and profitability metrics monthly to ensure accurate monitoring and quick response to operational changes.
How can retailers improve average transaction value?
Retailers can increase average transaction value through product bundling, cross-selling, strategic merchandising, and loyalty incentives.
What tools help retailers track KPIs effectively?
Modern POS platforms with integrated analytics dashboards allow retailers to monitor sales, inventory, and customer behavior metrics in real time.