A Multi-Location Owner Dashboard is no longer a luxury for expanding retailers. It is a necessity. As soon as you operate more than one store, spreadsheets stop working, fragmented reports slow decisions, and visibility gaps begin to cost real money. Therefore, a centralized performance system becomes essential for control and growth.
Many multi-unit operators struggle with disconnected reporting. Meanwhile, managers send updates in different formats, and owners spend hours compiling numbers manually. A properly designed Multi-Location Owner Dashboard eliminates that chaos by offering a consolidated performance view in real time. Instead of reacting to problems days later, you gain immediate insight into revenue, margins, and operational trends.
When you implement a powerful multi location dashboard, you shift from managing stores individually to leading the entire business strategically. This article explains how a centralized business dashboard works, what features matter most, and how it transforms decision-making for growing retail and restaurant brands.
Table of Contents
- Why a Multi-Location Owner Dashboard Matters
- Core Features of a Powerful Dashboard
- Location Comparison and Performance Insights
- Centralized Financial Oversight Made Simple
- Operational Control Across All Stores
- Executive Reporting and Strategic Planning
- How Biyo POS Delivers a Modern Dashboard
- FAQ
Why a Multi-Location Owner Dashboard Matters
As your business grows, complexity increases quickly. While one location may be manageable with manual reports, multiple stores create layers of operational challenges. Therefore, a Multi-Location Owner Dashboard becomes the central command center.
Eliminating Fragmented Reporting
Without a centralized system, each store may generate reports separately. Managers send spreadsheets, PDFs, or screenshots at different times. Meanwhile, owners must combine that data manually.
A Multi-Location Owner Dashboard consolidates reporting into one interface. Instead of switching between files, you view unified data instantly. As a result, decision-making becomes faster and more accurate.
Consolidation also reduces reporting errors. When data flows automatically from your POS analytics dashboard, you eliminate inconsistencies caused by manual entry.
Beyond consolidation, speed of access matters equally.
Real-Time Revenue Tracking Across Locations
Real time revenue tracking allows owners to monitor sales performance as it happens. If one location underperforms during peak hours, you see it immediately. Therefore, you can intervene before losses accumulate.
A Multi-Location Owner Dashboard provides instant updates across all stores. Meanwhile, you can compare hourly, daily, and weekly sales trends without waiting for end-of-day reports.
This visibility builds confidence. When revenue data updates live, you make decisions based on facts rather than assumptions.
 Core Features of a Powerful Dashboard
 Core Features of a Powerful Dashboard
Not all dashboards are equal. A basic reporting screen does not qualify as a true Multi-Location Owner Dashboard. Instead, it must provide actionable insight.
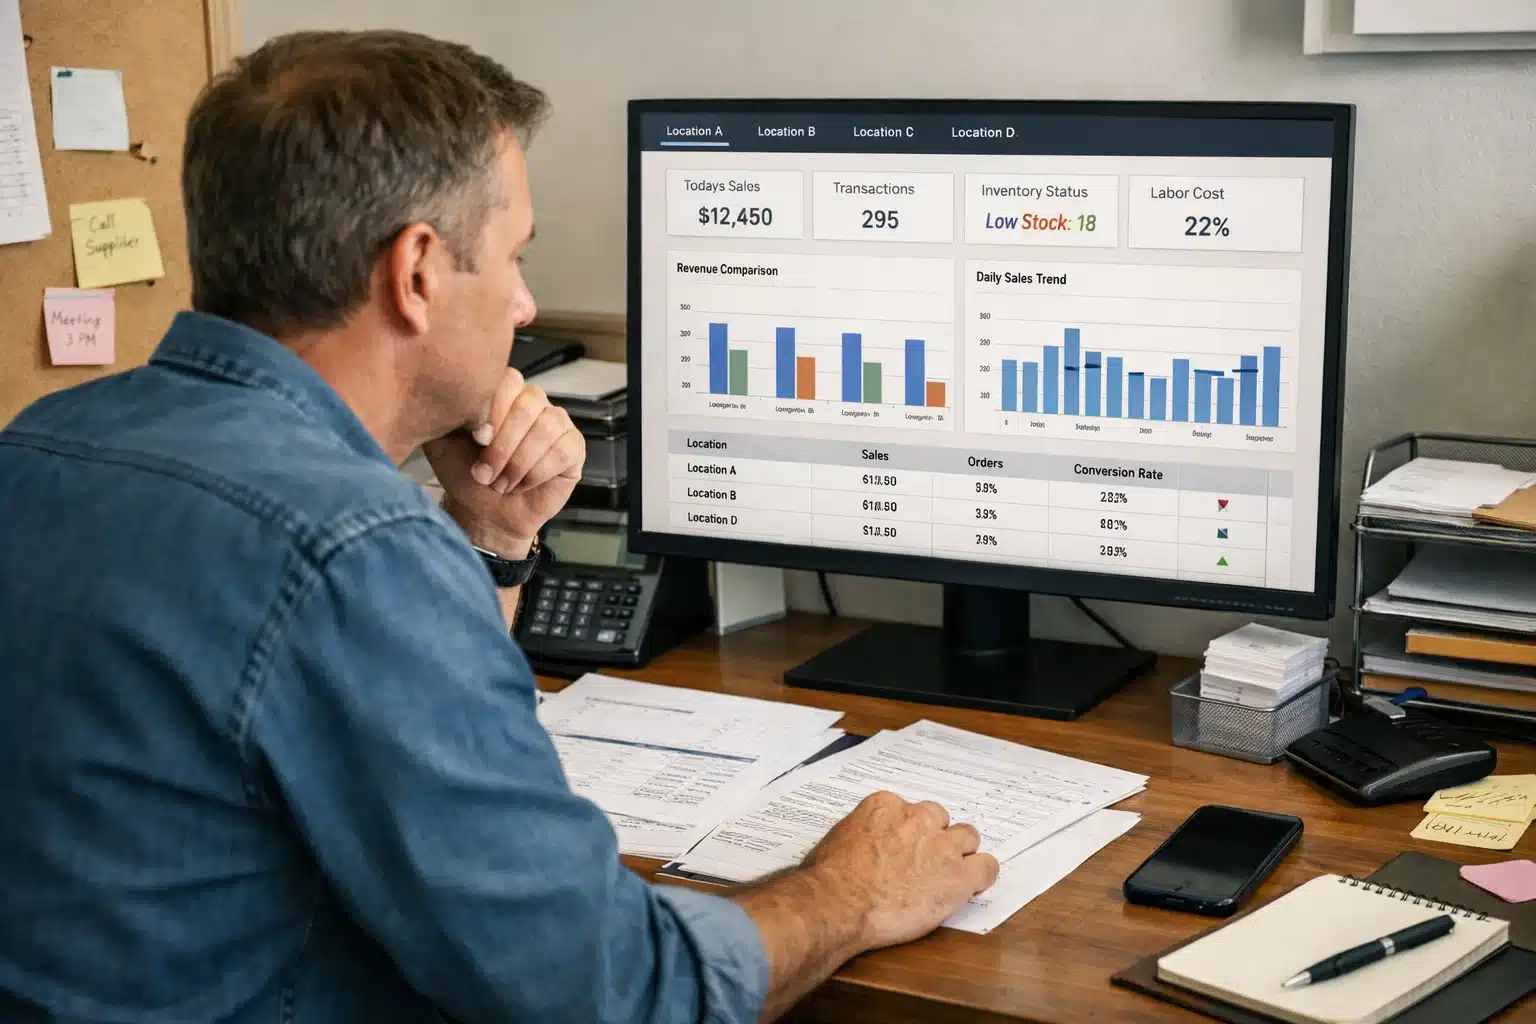
Consolidated Performance View
A consolidated performance view combines sales, margins, inventory, and labor data into one screen. This structure prevents siloed analysis. Therefore, you see how metrics influence each other.
For example, declining margins may connect directly to discount activity. Meanwhile, rising labor costs may explain reduced profitability at specific stores.
When your multi store reporting dashboard presents metrics side by side, you gain clarity quickly.
However, summary data alone is not enough.
Drill-Down Capability by Location
A strong Multi-Location Owner Dashboard allows you to click into individual stores for deeper insight. While consolidated data provides an overview, drill-down features reveal root causes.
You can analyze specific transactions, employee performance, or product categories at each location. Therefore, problem-solving becomes precise rather than generalized.
This flexibility ensures that you do not lose detail while maintaining centralized oversight.
Location Comparison and Performance Insights
Growth depends on understanding differences between stores. A Multi-Location Owner Dashboard makes comparison simple and structured.
Location Comparison Metrics
Location comparison metrics highlight performance differences across revenue, margin, and average transaction value. Therefore, you identify top-performing stores quickly.
If one location consistently outperforms others, you can replicate its strategies. Meanwhile, underperforming stores receive targeted support.
Clear comparisons remove guesswork. Instead of relying on manager opinions, you rely on measurable data.
Comparison data also strengthens accountability.
Benchmarking for Operational Standards
Benchmarking allows you to set performance standards based on top locations. When every store aims to reach similar KPIs, consistency improves. Therefore, operational gaps become visible immediately.
A Multi-Location Owner Dashboard can display ranking systems or scorecards. Meanwhile, managers understand how their performance compares to peers.
This transparency motivates improvement and reinforces company-wide standards.
Centralized Financial Oversight Made Simple
Financial clarity protects business stability. Without centralized oversight, financial blind spots may appear between locations.
Centralized Financial Oversight
A centralized business dashboard combines revenue, expenses, and margin data across all stores. Instead of reviewing each location separately, you see total business performance instantly.
This aggregated perspective highlights overall profitability trends. Meanwhile, you can identify which stores contribute most to growth.
With one Multi-Location Owner Dashboard, financial oversight becomes streamlined and consistent.
Cost control also requires detailed monitoring.
Expense and Labor Visibility
Labor costs often vary significantly between locations. Therefore, monitoring wage percentage relative to revenue becomes essential.
A strong dashboard integrates labor tracking alongside sales performance. Meanwhile, expense analysis helps you control operational spending.
When you combine revenue and cost metrics in one view, profitability becomes easier to manage.
Operational Control Across All Stores
Operational consistency drives brand reputation. A Multi-Location Owner Dashboard supports control beyond financial metrics.
Inventory and Stock Monitoring
Centralized inventory tracking ensures stock levels remain balanced across locations. If one store experiences shortages while another holds excess inventory, the dashboard highlights discrepancies.
Real-time inventory updates improve transfer decisions. Therefore, you reduce waste and avoid stockouts.
Integrated POS analytics dashboard features strengthen operational coordination.
Employee performance also impacts overall results.
Employee and Productivity Insights
Productivity metrics help owners evaluate staffing efficiency. For example, sales per employee reveals labor effectiveness.
A Multi-Location Owner Dashboard allows you to compare team performance across stores. Meanwhile, you can reward high performers and provide coaching where needed.
Consistent performance tracking fosters accountability throughout the organization.
Executive Reporting and Strategic Planning
Strategic decisions require reliable data. Executive reporting tools within a Multi-Location Owner Dashboard simplify high-level planning.
Automated Executive Reports
Instead of manually compiling reports, automated summaries generate instantly. Therefore, leadership meetings focus on strategy rather than data collection.
Weekly and monthly performance reports provide clarity on trends. Meanwhile, historical comparisons support forecasting accuracy.
Automation saves time and improves reliability.
Long-term planning benefits from accurate projections.
Data-Driven Expansion Decisions
Before opening a new store, owners must evaluate existing performance carefully. A consolidated performance view reveals whether the business model scales effectively.
If multiple stores demonstrate stable profitability, expansion risk decreases. Meanwhile, inconsistent results may signal operational gaps.
A Multi-Location Owner Dashboard supports confident growth planning through accurate, centralized insight.
How Biyo POS Delivers a Modern Dashboard
 How Biyo POS Delivers a Modern Dashboard
Biyo POS provides a powerful Multi-Location Owner Dashboard designed for retailers, restaurants, and kiosks. Because Biyo operates in the cloud, owners gain real time revenue tracking, location comparison metrics, and centralized financial oversight from any device.
Its multi location dashboard integrates inventory management, sales reporting, and employee tracking into one unified system. Therefore, you access executive reporting tools without juggling multiple platforms. Meanwhile, automatic cloud backup ensures data security and reliability.
If you want a centralized business dashboard that supports growth and operational clarity, you can schedule a live demo or explore the platform directly via the Biyo signup page.
FAQ
What is a Multi-Location Owner Dashboard?
A Multi-Location Owner Dashboard is a centralized system that displays consolidated performance data across multiple stores in real time.
Why do multi-store businesses need centralized reporting?
Centralized reporting eliminates fragmented data and provides consistent oversight, improving speed and decision-making accuracy.
What metrics should a multi-location dashboard include?
Important metrics include revenue tracking, margin analysis, inventory levels, labor costs, and location comparison metrics.
Can a dashboard support expansion decisions?
Yes. A consolidated performance view provides insight into operational consistency, helping owners plan new locations strategically.