Point of sale reporting is what turns a simple list of transactions into a powerful story about your business. It's the art of gathering all that raw data from your checkout, analyzing it, and presenting it in a way that reveals what's really going on with your sales, inventory, and customers. This isn't just about counting cash at the end of the day; it's about understanding the "why" behind every single sale.
Understanding Your Business Dashboard
Think of your business like a car. The sales you make are the engine, pushing you forward. In this analogy, point of sale reporting is your dashboard—it gives you the real-time feedback you need to speed up, slow down, and steer clear of trouble.
Without that dashboard, you're driving blind. Sure, you might feel the speed, but you have no idea how much fuel is left, if the engine is overheating, or if you're even going in the right direction. This is exactly where a modern POS system completely changes the game.
From Cash Register to Command Center
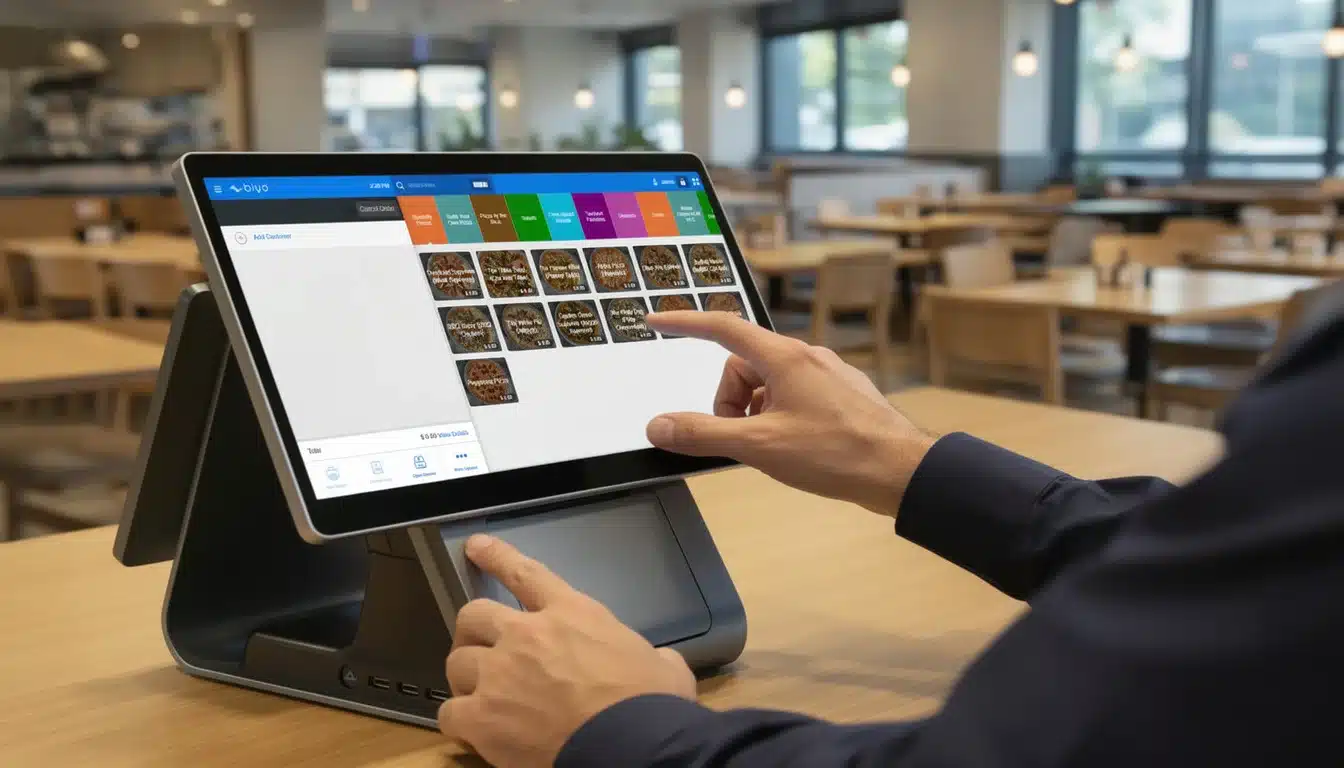
It wasn't that long ago that a cash register did one thing: hold cash. Business owners had to spend hours manually counting receipts and tallying sales, a tedious job that was full of potential errors. Today's POS systems are less like cash drawers and more like mission control.
Every time a customer buys something, the system is capturing a ton of information—not just the price, but the exact item, the time of day, how they paid, and which employee rang them up. If you're curious about the nuts and bolts of it all, our guide on how does point of sale work breaks it down perfectly.
A modern POS system doesn't just process payments. It captures the DNA of every transaction, giving you the building blocks for a smarter business strategy.
Turning Data into Decisions
The real magic of point of sale reporting is how it translates all that raw data into clear insights you can actually use. This entire process is grounded in solid data analysis, a discipline well-explored in guides to ecommerce data analytics. By neatly organizing transaction details into reports you can actually read, your POS helps you answer the questions that matter most.
- What are my best-selling products? Knowing this helps you keep popular items in stock and feature them in your marketing.
- When are my busiest hours? This is crucial for smart staff scheduling, ensuring you're never under or overstaffed.
- Who are my most loyal customers? You can use this info to create loyalty programs that keep them coming back.
- Which marketing campaigns are actually working? This helps you put your advertising dollars where they’ll have the biggest impact.
Once you get comfortable with these reports, you stop making decisions based on hunches and start building a strategy based on hard facts. In today's market, that’s not just an advantage—it’s essential for survival.
Key Metrics To Track In Your POS Reports
Opening up your point of sale reporting dashboard for the first time can feel like you're trying to fly a commercial jet. It's a sea of charts, graphs, and numbers. But here’s the secret: you don't need to track everything. The real goal is to zero in on the specific metrics that tell the true story of your business's health.
Think of these key performance indicators (KPIs) as your business's vital signs. They help you spot problems before they get serious and uncover opportunities you might have otherwise missed. When you look past the top-line revenue number, you start to see not just what happened, but why it happened. And that’s where the best business decisions come from.
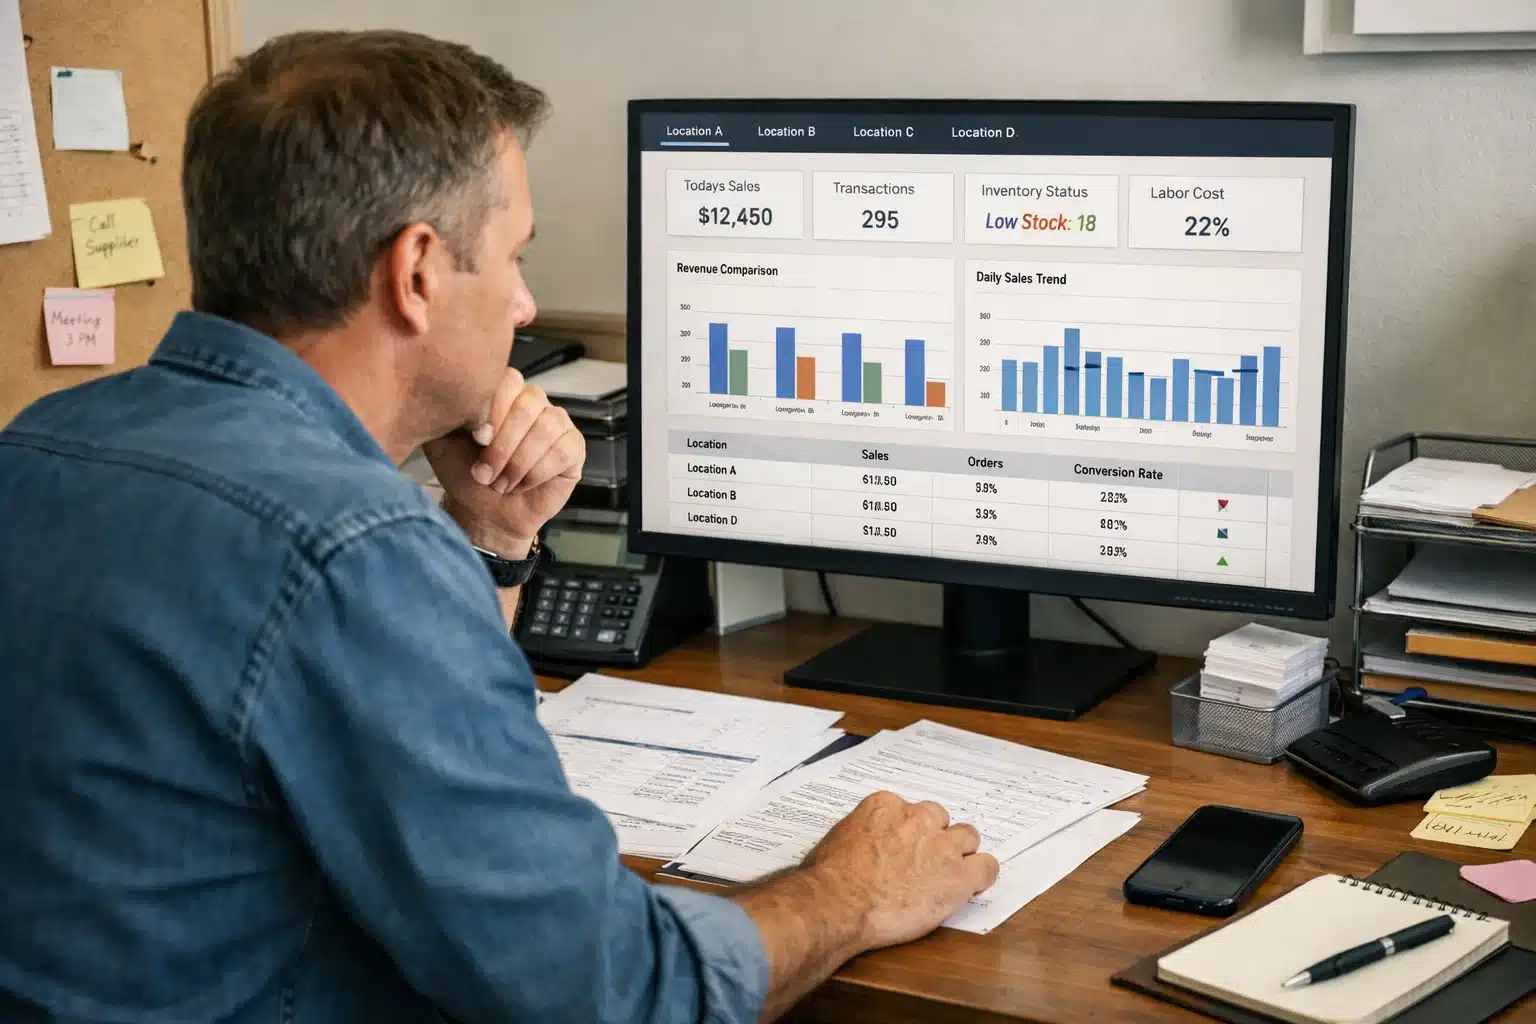
The data can paint a clear picture of your performance, showing you everything from monthly sales trends to which payment methods your customers prefer.
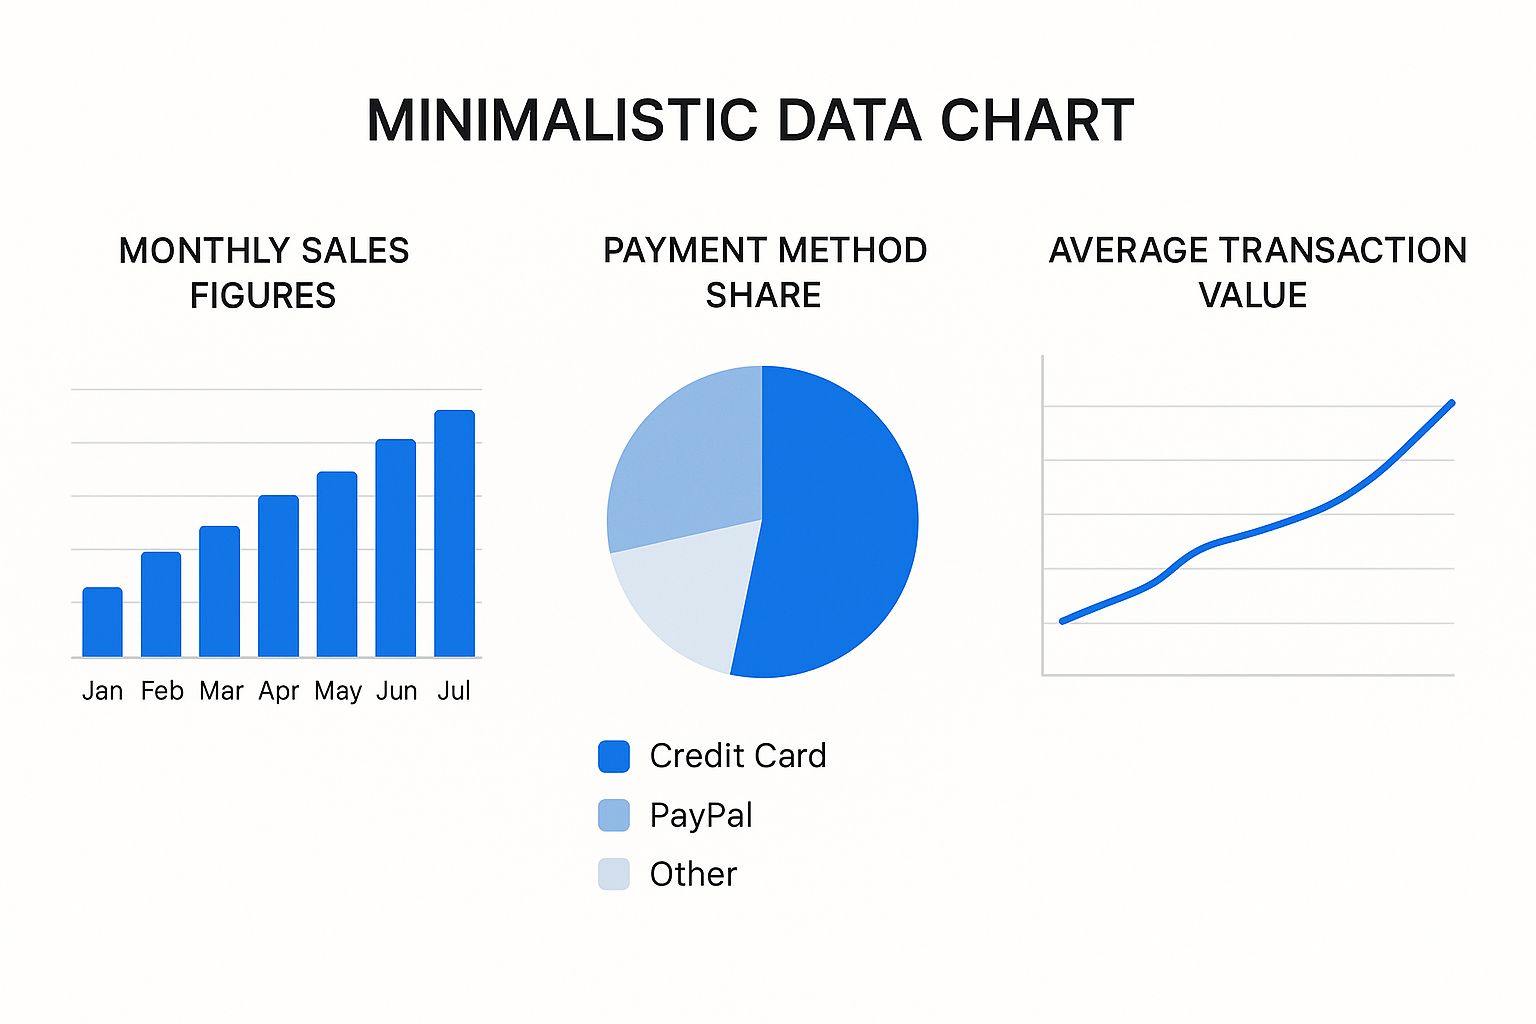
Visuals like this make it easy to see, for example, a spike in sales during a particular month or a gradual shift toward digital wallets. That’s an insight you’d struggle to find buried in a spreadsheet.
To help you get started, here’s a quick overview of the most important metrics you should be watching.
Key POS Reporting Metrics at a Glance
| Metric | What It Measures | Why It's Important |
|---|---|---|
| Net Sales | Total revenue minus discounts, returns, and allowances. | Gives you the most accurate view of your actual earned income. |
| Average Transaction Value (ATV) | The average amount a customer spends in a single purchase. | Shows the effectiveness of your upselling and cross-selling efforts. |
| Inventory Turnover | How many times you sell through your entire stock in a period. | Reveals how efficiently you're managing inventory and if cash is tied up in slow-moving items. |
| Sales Per Employee | The total sales generated by each staff member. | Helps identify top performers and highlights coaching opportunities for the team. |
| Profit Margin | The percentage of revenue that turns into actual profit. | The ultimate measure of your business's financial health and sustainability. |
Let's break down each of these metrics to see how they work in the real world.
Foundational Sales Metrics
Before you can get into the nitty-gritty, you need to have a solid handle on the basics. These foundational metrics are the bedrock of any good sales report, giving you a high-level snapshot of your financial performance.
The most important figure here is Net Sales. This isn't just your total revenue; it's what's left after you subtract all the discounts, returns, and other allowances. This number shows what you actually earned.
For example, if your boutique sold $5,000 worth of clothes but had to process $300 in returns and gave out $200 in promotional discounts, your net sales for that period would be $4,500. Tracking this helps you see how much promotions are really costing you.
Understanding Customer Spending Habits
Okay, so you know how much money you’re making. The next question is: how are your customers spending it? These metrics help you zoom in on individual transactions to find ways to increase the value of every single customer visit.
A fantastic metric for this is the Average Transaction Value (ATV). You calculate it by dividing your total net sales by the number of transactions you had. Simply put, it tells you what the average customer spends when they buy from you.
A rising ATV is almost always a sign of a smart sales strategy. It means your team is getting better at upselling and cross-selling, boosting your total revenue without necessarily needing more customers to walk through the door.
Imagine a small coffee shop has an ATV of $6.50. The owner starts training baristas to ask every customer, "Would you like to try our fresh-baked croissant with that?" Soon, the ATV climbs to $8.00. That extra $1.50 might seem small, but over thousands of transactions, it adds up to a massive boost in revenue.
Gauging Operational Efficiency
Your POS reports aren't just for tracking money; they're also a powerful tool for measuring how smoothly your business is running. These metrics focus on two of your most valuable assets: your inventory and your team. The raw information your system gathers is the starting point, and you can dive deeper by learning https://biyopos.com/blog/what-is-pos-data-definition-the-key-to-smarter-sales-tracking/ in our detailed guide.
Inventory Turnover tells you how many times you sell and replace your entire inventory over a specific period. A high turnover rate is usually a great sign—it means products are flying off the shelves and you're not wasting money on stock that just sits there. A low rate, on the other hand, can be a red flag for overstocking or unpopular items.
Sales Per Employee is another killer metric for efficiency. It's calculated by dividing your net sales by the number of employees who worked during that time. This data is invaluable for managing your team.
- Top Performers: You can easily spot who your sales superstars are and reward them for their great work.
- Coaching Opportunities: It also helps you see which team members might need a bit more training or support to hit their stride.
Profitability And Financial Health
At the end of the day, it all comes down to one thing: profit. Your POS reports provide the essential sales data you need to figure out if your business is actually making money. These metrics connect the dots between your sales, your operations, and your bottom line.
Profit Margin is arguably the most important metric for any business. It reveals what percentage of your revenue is actual profit after all expenses are paid. Your POS gives you the sales figures, but to get a true profit margin, you'll also need to account for your cost of goods sold (COGS).
For a restaurant, this is non-negotiable. You have to constantly track food costs against your menu prices. Using POS data is the key to accurately calculating your restaurant's profit margin. It allows you to adjust pricing, reduce waste, and build a menu that's not just delicious but also highly profitable.
How Smart Reporting Transforms Business Operations
Think of the raw data from your POS system as a pantry full of ingredients. On their own, they have potential, but they aren’t a meal until a chef works their magic. Smart point of sale reporting is that chef—it takes all those numbers and cooks them into insights that actually nourish your business.
This is where the figures on your screen jump into the real world, directly influencing your day-to-day operations. When you use them right, these reports become your secret weapon, helping you sharpen everything from how you stock your storeroom to how you greet customers at the front counter.
This shift to data-driven decision-making isn't just a passing fad; it's a fundamental change in how successful businesses are run. The global market for POS software, valued at around USD 14.76 billion, is expected to soar to USD 41.53 billion by 2034. That growth is fueled by this very need for smarter, faster insights. You can discover more details on the growth of the Point of Sale software market.
Perfect Your Inventory Management
Few things kill profits faster than running out of a bestseller. On the flip side, having cash tied up in products that are collecting dust is just as bad. Point of sale reporting gives you the clarity to walk that fine line between supply and demand.
Let’s look at a local pizzeria. The owner dives into their sales reports and sees a clear pattern: they sell out of pepperoni every Friday night, turning away hungry customers. At the same time, the data shows they barely sell one anchovy pizza a week.
With this knowledge, they can make two simple, yet powerful, changes:
- Boost the Winner: They increase their weekly pepperoni order to handle the predictable Friday rush, making sure they never run out again.
- Cut the Loser: They can either drop anchovies from the menu or slash the amount they keep in stock, freeing up cash and valuable cooler space.
This isn't just a hunch. It's a precise strategy based on what customers are actually buying. Your reports show you exactly what’s flying off the shelves and what’s not, so you can stop wasting money and start maximizing every sale.
Build Stronger Customer Relationships
Who are your regulars? What do they love? Your POS system holds the answers. By digging into purchase histories, you can stop shouting generic marketing messages and start having personal conversations that build real loyalty.
Picture a boutique clothing store. The owner pulls a report on customer spending and spots a small group of shoppers who consistently buy high-end designer handbags. Instead of sending out another "20% off everything" email blast, she gets strategic.
Using purchase data, you can segment your audience and deliver messages that feel personal and relevant. This approach makes customers feel understood and valued, turning one-time buyers into lifelong fans.
The boutique owner could send an exclusive email to just that group, giving them a sneak peek at an incoming designer collection. This targeted approach works wonders because it speaks directly to their known interests, making them feel like true VIPs.
Boost Team Performance and Morale
Your employees are the heart of your business, and POS reports can help you bring out their best. By tracking sales data for each staff member, you can quickly see who your superstars are and who might need a bit of extra coaching.
This isn't about fostering a high-pressure, cutthroat sales floor. It's about recognizing great work and offering targeted support. For instance, a cafe manager might notice one barista’s average transaction value (ATV) is consistently higher than everyone else's.
Instead of just giving them a pat on the back, the manager asks them to share their upselling techniques with the team. This builds a culture of shared success where everyone learns from the best, lifting both skills and spirits across the board. It transforms performance data from a simple metric into a tool for growth.
Make Smarter Strategic Decisions
Ultimately, point of sale reporting gives you the confidence to make the big-picture decisions that define your future. Should you stay open later? Is it time to adjust prices? Is a new location viable? The answers are sitting in your data.
A coffee shop owner might be toying with the idea of extending her hours. Instead of making a costly guess, she analyzes her hourly sales reports. She sees a major drop-off in traffic after 3 PM but a huge, surprising rush on Saturday mornings.
Armed with this evidence, she scraps the plan for later evenings—saving a fortune on labor—and instead schedules an extra barista for the Saturday morning shift to improve service during that peak. That's how data helps you dodge expensive mistakes and pave the way for sustainable growth.
How to Choose the Right POS Reporting System
Picking a new point of sale system is a huge deal for any business. They’re not all built the same, and the quality of the reporting can make or break your ability to grow. You're looking for more than a simple cash register; you need a partner that delivers clear, actionable insights to help you make smarter decisions.
The right system should feel like an extension of your own intuition, giving you the information you need, right when you need it. It’s about finding a tool that handles today’s demands while being ready to scale with you tomorrow.
Look for Dashboards You Can Actually Use
First things first: user experience matters. The most powerful point of sale reporting system in the world is worthless if it’s a nightmare to navigate. The best systems take complex data and lay it out in a clean, visual format you can understand in seconds.
Keep an eye out for dashboards that are intuitive and, crucially, customizable. You need the ability to put the metrics that matter most to your business front and center.
For example, a boutique owner will want to see inventory turnover and top-selling products the second they log in. A café manager, on the other hand, will care more about sales per hour and menu item performance. A system that lets you build your own dashboard saves a ton of time and keeps you focused on what's important.
A great POS dashboard doesn't just throw numbers at you; it tells a story. It translates raw data into a clear narrative about your business’s health, helping you spot trends and opportunities instantly.
Make Sure It Plays Well with Others
Your POS system doesn't live on an island. It has to connect and talk to all the other tools you rely on, from your accounting software and e-commerce site to your employee scheduling app.
Without smooth integrations, you’re stuck manually exporting and importing data. That’s not just a headache; it’s a recipe for costly mistakes. A modern POS should act as the central nervous system for your entire operation, keeping everything in sync.
Think about these critical connections:
- Accounting Software: Automatically pushes sales data, saving you from hours of bookkeeping and making tax time a breeze.
- E-commerce Platforms: Unifies your online and brick-and-mortar inventory, so you never accidentally sell an out-of-stock item online.
- Employee Scheduling Tools: Links sales figures to labor costs, giving you a crystal-clear look at your staffing efficiency.
This kind of connected setup means a sale on your website instantly updates your in-store stock levels, and the day's revenue automatically appears in your accounting books. No fuss, no errors.
Go with the Cloud for Modern Agility
The old debate between on-premise and cloud-based POS systems is pretty much over. For almost any business today, a cloud-based solution is the obvious choice for its flexibility, security, and sheer convenience.
Cloud-based systems store your data securely online, meaning you can pull up sales reports from anywhere with an internet connection—your back office, your living room, or even a beach. This is a massive advantage for owners who need to stay on top of things without being tied to the shop floor. This shift allows for real-time data, remote management, and easy integrations.
On top of that, cloud systems update themselves automatically. You always get the latest features and security patches without having to lift a finger. It takes the IT burden off your shoulders so you can get back to what you do best: running your business.
Putting Advanced Reporting Into Practice with Biyo POS
It’s one thing to talk about the theory behind good reporting, but it’s another thing entirely to see it in action. A great point of sale system doesn’t just crunch numbers; it serves up insights that you can actually use, right away. That’s the entire philosophy behind Biyo POS—turning complex data into a simple, powerful tool for your daily decisions.
Instead of getting lost in a sea of spreadsheets, Biyo is all about clarity. Its reporting tools are built to solve the real-world problems we’ve been discussing, from managing your inventory better to truly understanding what makes your customers tick. It brings sophisticated analytics, once only available to big-box retailers, to your fingertips in a way that just makes sense for a busy owner.
Your Business Health at a Glance
The first thing you'll find in Biyo is a clean, visual dashboard. Think of it as the real-time pulse of your business. It gives you a quick snapshot of your most important metrics so you can spot trends as they’re happening, not a month later.
You get an immediate, easy-to-understand view of your key performance indicators.
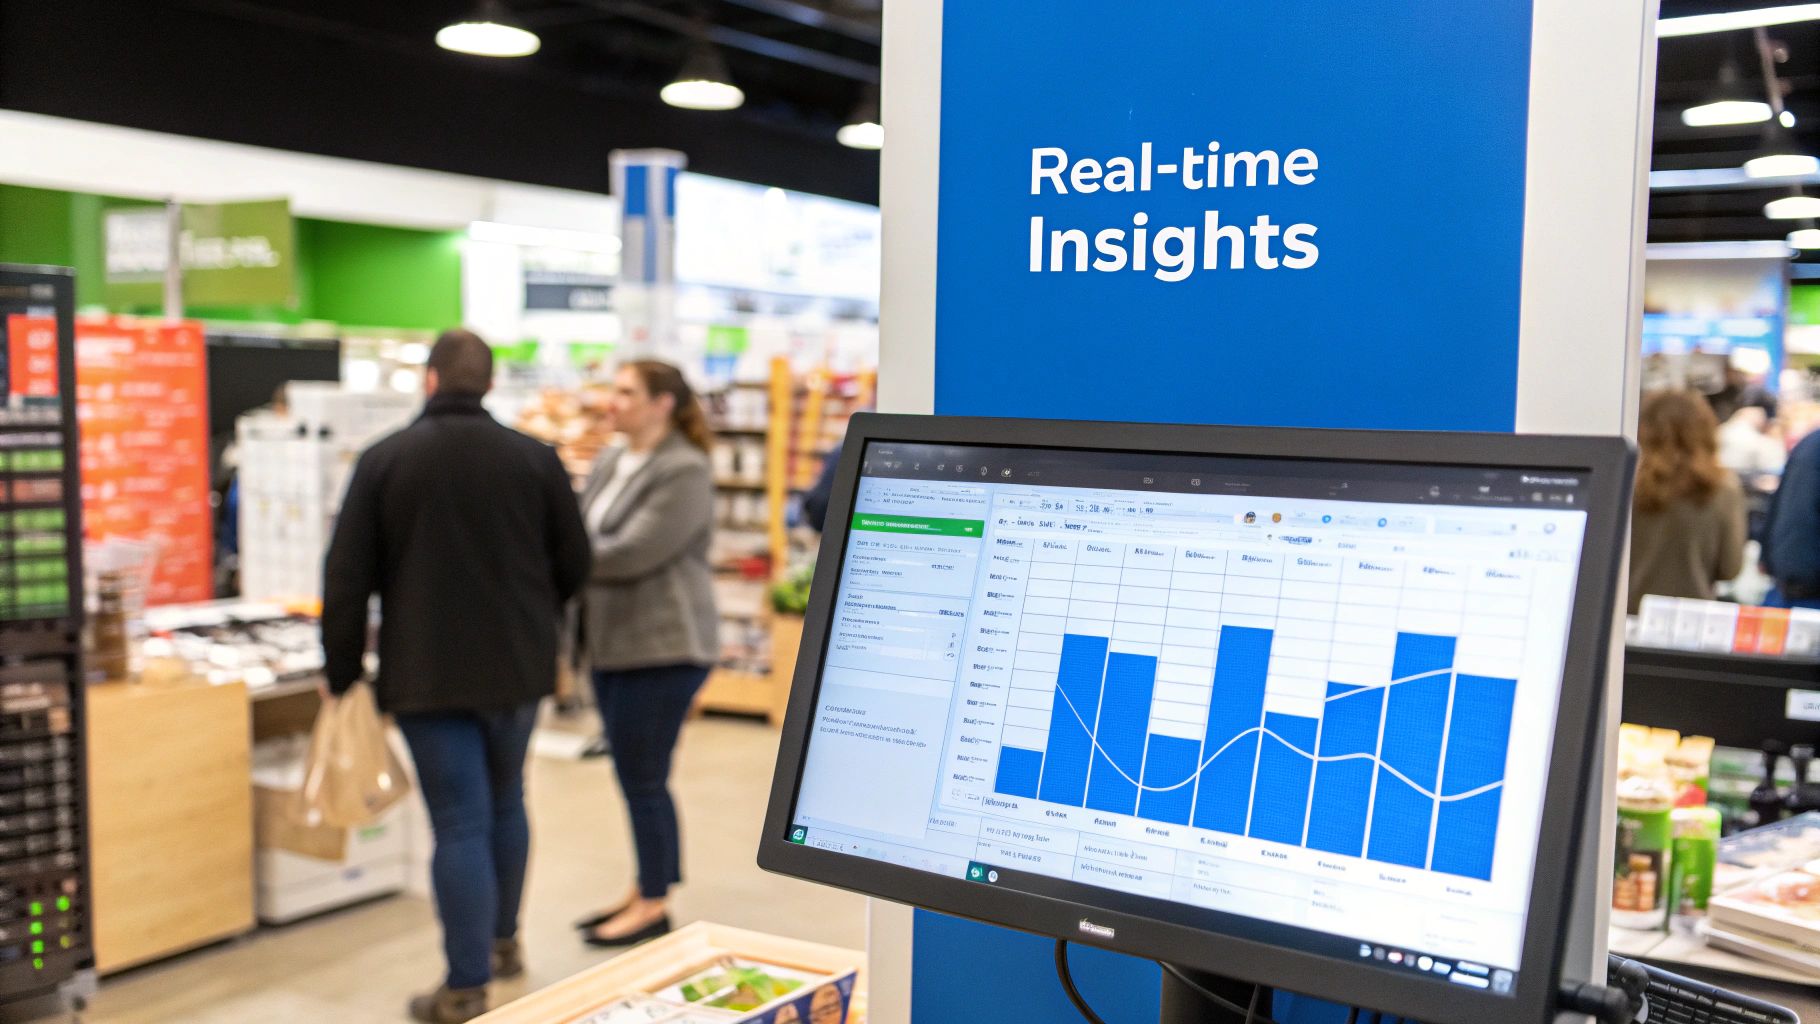
Right away, this dashboard shows you total sales, your hottest-selling items, and transaction volumes, letting you check your performance in just a few seconds. It’s all about helping you make smarter choices on the fly—whether that means calling in an extra staff member for an unexpected rush or building a promotion around a product that's suddenly flying off the shelves.
Biyo’s real strength is making this level of analysis easy to access. You don't have to be a data wizard to see what's working. The system does all the heavy lifting for you, freeing you up to focus on the big picture.
Dive Deeper with Specific Biyo Reports
While the dashboard is great for a high-level overview, Biyo also provides a suite of detailed reports to let you zoom in on specific parts of your business. Each one is designed to answer a critical question, giving you the solid data you need to act with confidence. Two of the most valuable are the Sales Summary and the Product Performance dashboard.
The Sales Summary report is basically your financial command center. It slices your revenue data in a few crucial ways:
- Net Sales: See your true earnings after accounting for discounts and returns.
- Payment Type: Understand how your customers prefer to pay, which helps you fine-tune your payment options.
- Employee Performance: Pinpoint your top performers by tracking sales by team member, which is fantastic for recognizing talent and identifying coaching moments.
Imagine you run a small café. You check the Sales Summary and notice that one barista’s average ticket size is 25% higher than everyone else's. That’s not a reason to scold the others; it's a golden opportunity. You can find out what they're doing—maybe a fantastic upselling technique—and train the rest of your team to do the same, lifting everyone's numbers.
This is a perfect example of how Biyo turns raw transaction data into a genuine management tool. As you evaluate different systems, seeing how Biyo stacks up as a powerful alternative to Clover really shows how crucial these intuitive reporting features are.
Optimize Everything with Product Performance Insights
Next up is the Product Performance dashboard. This is where you get to work refining your menu or product catalog. It gives you a line-by-line breakdown of what's selling, what’s gathering dust, and which items are actually making you the most money. It’s your roadmap to smarter inventory management.
Let’s say you own a retail boutique. This report might reveal that your best-selling t-shirt has a razor-thin profit margin, while a high-margin jacket isn't moving nearly as fast. Armed with that knowledge, you could:
- Run a Promotion: Move that high-margin jacket to a prime spot in the store and feature it in your marketing to get more eyes on it.
- Bundle Products: Create a special deal that pairs the popular t-shirt with a higher-margin accessory, boosting the overall profitability of the sale.
- Adjust Stock: Cut back on orders for slow-moving products to free up cash and valuable shelf space for your true winners.
This is the kind of detailed reporting that takes all the guesswork out of the equation. Biyo gives you the hard numbers you need to curate a more profitable product mix, making sure every single item you sell is working hard for your bottom line.
Where Point of Sale Reporting is Headed Next
Point of sale reporting isn't standing still. It's evolving from a simple tool that tells you what happened yesterday into an intelligent system that helps you predict what’s coming tomorrow. This shift is turning raw sales data into a powerful strategic advantage for businesses.
The sheer volume of digital transactions worldwide is what makes this evolution possible. All that data flowing through millions of terminals is the perfect raw material for the next generation of business analytics.
AI and Predictive Analytics are Changing the Game
The biggest leap forward is coming from Artificial Intelligence (AI) and machine learning. Think about it this way: traditional reporting is like looking in your car's rearview mirror. It’s great for seeing where you've been, but it doesn't tell you much about the road ahead. AI-powered reporting is more like a GPS, analyzing real-time data to predict the best route forward.
So, instead of a report just showing you that sales were high last Friday, an AI-driven system can look at years of your sales history, factor in the weather forecast, and even consider local events to predict next Friday's sales with surprising accuracy.
This opens up a whole new way of running your business proactively:
- Smarter Inventory: The system can anticipate a surge in demand and suggest reordering key products or ingredients before you run low. This means fewer missed sales and less waste.
- Optimized Staffing: By forecasting busy and slow periods, you can build staff schedules that match customer traffic. You’ll have all hands on deck for a rush but won't be overstaffed during quiet hours.
- Spotting Future Trends: AI is brilliant at catching subtle patterns in customer behavior that a human might miss, helping you identify the "next big thing" before your competitors do.
Predictive analytics turns your point of sale reporting from a reactive tool into a strategic advisor. It shifts the core question from "What happened?" to "What should we do next?"
The Rise of Omnichannel Reporting
The modern customer doesn't just shop in one place. They might browse your website on a laptop, check out a product in your physical store, and finally buy it through your mobile app later that day. If your reporting for each of these channels is siloed, you’re only seeing small, disconnected pieces of the puzzle.
Omnichannel reporting is the solution. It pulls all your data streams—from your brick-and-mortar store, e-commerce site, social media sales, and more—into one unified dashboard.
This gives you a true 360-degree view of your business and, more importantly, your customers. You can finally see the entire customer journey, figure out which channels are actually driving sales, and create marketing that feels personal and consistent, no matter where someone chooses to shop with you.
Got Questions About POS Reporting? We've Got Answers.
Diving into point of sale reporting often brings up a few questions. It's a powerful tool, and it's normal to wonder how to get the most out of it. Let's tackle some of the most common things business owners ask.
How Often Should I Actually Look at My Reports?
This is a great question, and there’s no single right answer—it depends on what you're trying to learn.
Think of it like checking the dashboard of your car. You glance at your speed (daily sales) constantly to make immediate adjustments. You check your fuel level (weekly staff performance or inventory) regularly to plan for the near future.
Then, you have your long-term engine health and maintenance schedule (monthly or quarterly reports). These are what you use for bigger strategic decisions, like analyzing profit margins and spotting long-term customer trends.
Is This Really Necessary for a Small Business?
Absolutely. In fact, for a small business, it's arguably more critical. When you're running on tighter margins, every decision counts, and guessing can be expensive.
POS reporting takes the guesswork out of the equation. It's your inside scoop on what’s really happening on the ground floor. You can instantly see your best-selling items, pinpoint your busiest times of day, and identify who your regulars are. This kind of insight is gold, letting you fine-tune your operations and marketing without wasting a dime.
If I Only Have Time for One Report, What Should It Be?
If you have to pick just one, make it the Sales Summary. This is your command center, the one report that gives you a bird's-eye view of your business's financial health.
It quickly shows you the essentials: gross sales, net sales, discounts you've given out, and taxes collected.
Think of the Sales Summary as your business's vital signs. It tells you immediately if you're on the right track and often points you directly to the areas that need a closer look.
Ready to stop guessing and start knowing? Biyo POS has powerful, easy-to-use reporting tools built right in, designed to give you the clarity you need to grow. See how our system can help you make smarter decisions, every single day. Explore Biyo POS today!