Calculating your inventory turnover ratio is pretty straightforward: you just divide your Cost of Goods Sold (COGS) by your Average Inventory. But don't let the simple math fool you. This one number tells a powerful story about how many times you've sold through your entire stock in a given period, giving you a crystal-clear look at your operational efficiency.
Why Inventory Turnover Is a Critical Business Metric
Before we jump into the "how-to," let's talk about why this number is so important. Think of it as a financial health check for your inventory. A high ratio is a great sign—it means your products are flying off the shelves and you're making smart purchasing decisions that line up with what your customers actually want. When you're efficient like this, you free up cash that would otherwise be sitting idle in unsold goods.
On the flip side, a low ratio can be a major red flag. It often points to problems like overstocking, sluggish sales, or even obsolete products collecting dust. All that unsold stock ties up your capital and drives up holding costs—think storage fees, insurance, and the risk of spoilage or damage—which quietly eats away at your profits.
Understanding Industry Differences
Here’s a crucial piece of advice: a "good" inventory turnover ratio isn't a one-size-fits-all number. It changes dramatically depending on your industry. A grocery store dealing with perishable items is going to have a much higher turnover than, say, a luxury car dealership. Context is everything.
Across the board, retail businesses often aim for a turnover ratio between 5 and 10 times a year because they need to keep fresh products on the shelves to meet constant demand. In contrast, a manufacturing company might have a ratio closer to 1, simply because of longer production cycles.
Key Terms for Your Calculation
To get an accurate number, you first need to get comfortable with the main ingredients of the formula. Nailing down these terms is the first real step toward mastering your point of sale inventory management.
This quick table breaks down exactly what you'll need.
| Term | What It Means for Your Business | Where to Find This Number |
|---|---|---|
| Cost of Goods Sold (COGS) | The direct costs tied to the products you sold, like materials and direct labor. | Pull this from your company's Income Statement. |
| Average Inventory | The average value of your inventory over a set time (like a year or a quarter). | You'll calculate this using your Balance Sheets. |
| Beginning Inventory | The value of your stock at the very start of the accounting period. | This is simply the ending inventory from the previous period. |
| Ending Inventory | The value of your stock at the very end of the accounting period. | Find this on your current period's Balance Sheet. |
Once you have these figures handy, you're ready to plug them into the formula and see what your turnover ratio reveals about your business.
Calculating Your Inventory Turnover Ratio
Alright, let's get down to the brass tacks. The inventory turnover ratio sounds complicated, but the math behind it is surprisingly simple. You just need one formula: Cost of Goods Sold (COGS) divided by Average Inventory.
The key is knowing where to find those two numbers in your business records. Let's break it down.
Finding Your Cost of Goods Sold (COGS)
First up is COGS. This is the total direct cost of everything you sold during a specific period. Think raw materials, the direct labor to make the product—anything that went directly into creating the items that left your shelves.
You can usually pull this number straight from your income statement. If you're looking for a deeper dive, learning how to master the cost of goods sold is a game-changer for improving your profit margins.
Calculating Your Average Inventory
Next, you'll need your Average Inventory. We use an average because it smooths out the natural peaks and valleys in your stock levels throughout the year. Relying on a single day's inventory count could give you a skewed picture, so this gives us a much more reliable baseline.
Finding it is easy. Just grab two figures from your balance sheets:
- Beginning Inventory: The value of your inventory at the start of the period (say, January 1st). This is the same number as your ending inventory from the period before.
- Ending Inventory: The value of your inventory on the last day of that same period (for example, December 31st).
With those two numbers in hand, the formula is:
(Beginning Inventory + Ending Inventory) / 2 = Average Inventory
And that's it. This simple calculation gives you a solid, representative figure for what your inventory was worth across the entire period.
A Real-World Calculation Example
Let's see how this works for a hypothetical business, "Crafty Corner Supplies." Looking at their books for the past year, they found:
- Cost of Goods Sold (COGS): $150,000
- Beginning Inventory (Jan 1st): $35,000
- Ending Inventory (Dec 31st): $25,000
First, they need to figure out their Average Inventory.
($35,000 + $25,000) / 2 = $30,000
So, their average inventory value for the year was $30,000. Now they can calculate the turnover ratio.
$150,000 (COGS) / $30,000 (Average Inventory) = 5
Crafty Corner's inventory turnover ratio is 5. This tells them they sold through and restocked their entire inventory five times over the course of the year. Not bad at all!
This entire process is really about tracking the flow of your assets, from goods sitting in a warehouse to cash in your bank account, as this graphic shows.
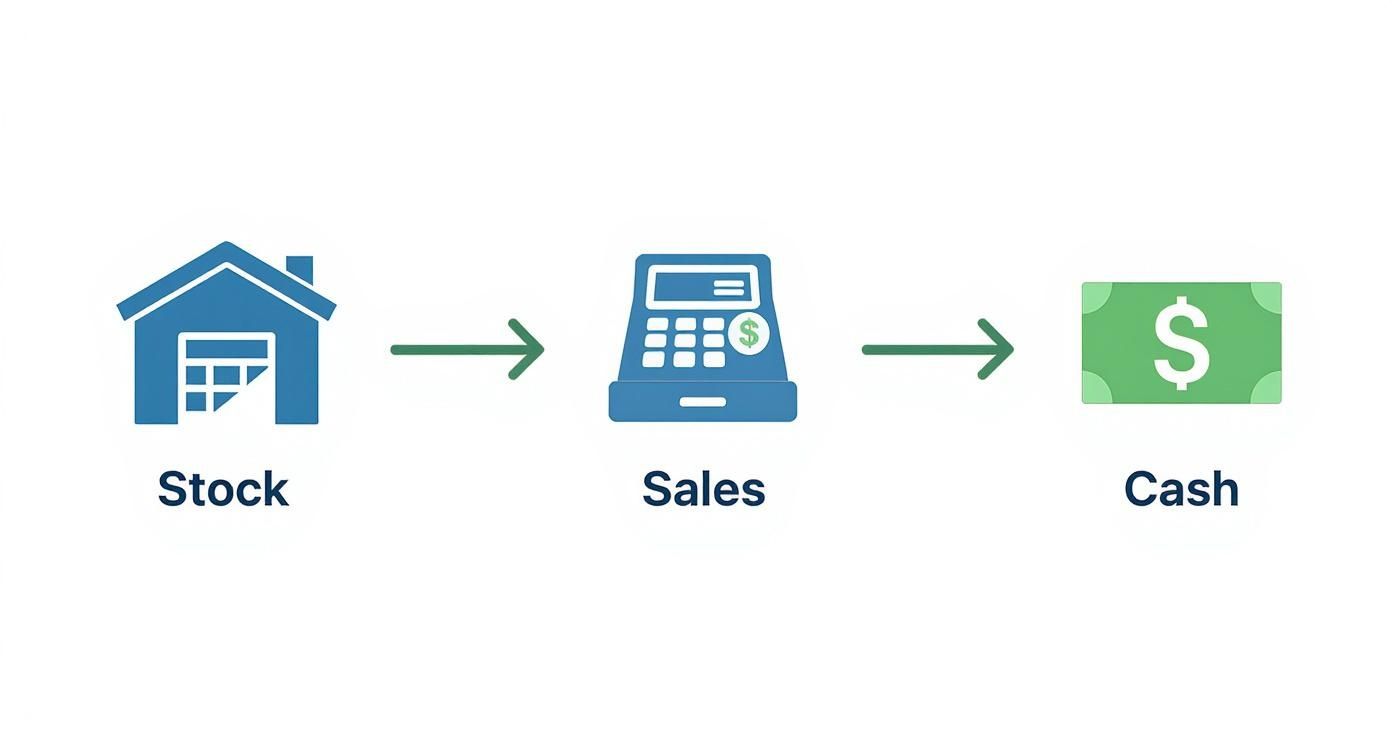
Ultimately, efficient inventory management is all about turning physical stock into liquid cash as quickly and smoothly as possible. A healthy turnover ratio is a clear sign that you're doing exactly that.
Interpreting What Your Ratio Really Means
So you've crunched the numbers and have your inventory turnover ratio. Great. But that number is just a starting point—the real magic is in understanding the story it tells about your business. Think of it as a health check-up for your operations; it reveals how well you're turning products on your shelves into cash in your pocket.
A single number can tell you if you're riding a wave of high demand, getting bogged down by operational drag, or even heading for a cash flow crunch.
Ultimately, whether your ratio is "good" or "bad" comes down to context. A high number tells one story, while a low one tells a completely different tale. Let's break down what each scenario means for you.
The Story of a High Turnover Ratio
Seeing a high inventory turnover ratio is usually a reason to celebrate. It’s a clear sign that your products are flying off the shelves and your purchasing strategy is hitting the mark with what customers actually want. This kind of efficiency is fantastic because it means less of your capital is just sitting there as stagnant inventory. That cash is freed up, ready to be reinvested back into your business.
But hold on—a ratio that's too high can be a red flag. If you're turning over stock at a frantic pace, it might mean your inventory levels are dangerously lean. This puts you at a serious risk of stockouts. Nothing frustrates a customer more than finding out their favorite item is gone, and those lost sales (and potentially lost customers) can really add up.
Decoding a Low Turnover Ratio
On the flip side, a low ratio often points to some trouble under the hood. It’s a classic symptom of overstocking, sluggish sales, or products that just aren't resonating with your audience anymore. That unsold inventory isn't just taking up valuable space; it's actively costing you money through storage fees, insurance, and the risk of the products becoming obsolete.
A low turnover ratio means your cash is sitting on a shelf instead of working for your business. It's a silent profit killer that can signal deeper issues with product demand or purchasing decisions.
This is especially critical in fast-moving industries. Take tech, for example. A high turnover is essential because products can become outdated almost overnight. Smart companies in that space keep their inventory incredibly lean to avoid getting stuck with last year's model.
In the end, this isn't just an accounting exercise. Your ratio is a diagnostic tool. Use it to see what's working and, more importantly, where you need to fine-tune your strategy. It also underscores just how crucial it is to choose the right inventory costing method from the get-go to ensure all your financial data is spot-on.
How External Forces Can Skew Your Numbers
It’s easy to look at your inventory turnover ratio and assume it’s a pure reflection of your own business performance. But the truth is, your numbers don’t exist in a vacuum. They're constantly being pushed and pulled by forces completely outside of your control.
Think about it. A sudden economic dip might make customers hold onto their cash, slowing down your sales and dragging down your turnover ratio, no matter how well you're managing things internally. On the flip side, a product suddenly going viral on TikTok could clear your shelves overnight, causing a huge, but temporary, spike in your ratio.
Recognizing these outside pressures is the key to accurately reading the story your data is trying to tell you.
Navigating Market and Supply Chain Shifts
The business world is never static, and your inventory metrics will always mirror that reality. We all got a masterclass in this during the recent global supply chain chaos.
At first, the ecommerce boom sent turnover rates soaring for many online sellers. But that was quickly followed by a nosedive as supply chains broke down, leaving businesses with empty shelves and delayed shipments. It was a classic case of demand and supply falling completely out of sync.
This isn't just an old story; it's an ongoing trend. Recent data shows a dip in average inventory turnover rates across multiple industries. This is a direct result of those lingering supply chain headaches, geopolitical issues, and general recession jitters. These factors all show just how much external events can impact your day-to-day operations. You can dig deeper into these inventory KPI findings over on ShipBob's blog.
When your numbers swing unexpectedly, your first question shouldn't be "What did we do wrong?" but "What's happening in the wider market?" This context helps you separate an internal problem from a broader industry trend.
By staying aware of these external forces, you can build a far more resilient and flexible inventory strategy. It’s the difference between reacting to problems as they happen and anticipating them before they hit your bottom line.
Proven Strategies to Improve Your Inventory Turnover
Okay, so you've calculated your inventory turnover ratio. That's the diagnosis. Now, let's talk about the cure. Boosting this number is all about making smarter, data-driven decisions so that what you stock aligns perfectly with what your customers are actually buying.
When you get this flow right, you don't just become more efficient. You free up cash that was stuck on your shelves in slow-moving products. The real aim is to move products faster without having to constantly run profit-killing sales or leaving customers empty-handed. It's a fine balance, really—a mix of sharp forecasting, smart pricing, and solid relationships with your suppliers.
Sharpen Your Demand Forecasting
Honestly, the best way to improve turnover is to stop overbuying from the get-go. Accurate demand forecasting lets you stock just enough to hit your sales targets without drowning in a surplus. This means getting cozy with your sales data to spot trends and patterns.
- Dig into historical sales: Pull up your past sales reports. Which items fly off the shelves, and which ones just sit there collecting dust? Keep an eye out for those seasonal rushes and lulls.
- Segment your inventory: Not all products are created equal. An ABC analysis is a great tool for classifying items based on their sales volume and value. Once you know your A-listers from your C-listers, you can create a buying strategy for each group.
- Lean on your POS data: Your Biyo POS system is a treasure trove of real-time information. Use it to watch daily sales velocity and adjust your purchasing decisions on the fly.
Taking this proactive approach keeps your capital from being wasted on products that simply don't have the demand to justify their shelf space.
Liquidate Slow-Moving Stock Strategically
Every business, and I mean every business, ends up with some slow-moving or obsolete stock. Letting it sit there is a costly mistake. The trick is to clear it out in a way that gets your cash back without cheapening your brand's image.
Think about creating targeted promotions, like bundling a slow-mover with a bestseller, or running a limited-time flash sale. The goal is to turn that stagnant inventory back into cash you can reinvest into products that actually sell.
Don't view unsold inventory as a sunk cost; see it as trapped cash. Your job is to free that cash up so it can start working for your business again.
For restaurants especially, where perishables are a huge factor, implementing a robust restaurant inventory management system can be a game-changer. It gives you the precision tools needed for tight tracking and optimization.
Improving your inventory turnover is an ongoing process of tweaking and refining, but these core tactics will put you on the right path toward a healthier, more profitable business.
Common Questions About Inventory Turnover
Once you start calculating your inventory turnover ratio, you’ll probably find yourself asking a few common questions. It’s a fantastic metric, but applying it in the real world has some nuances that can be tricky. Let's walk through the questions I hear most often to clear things up.
Getting these details right is the key to an accurate and useful inventory turnover ratio calculation.
What Is a Good Inventory Turnover Ratio for My Business?
Honestly, there's no single magic number. What’s considered "good" is completely different from one industry to the next. For example, a grocery store selling fresh produce might aim for a ratio of 5-10 because their goods are perishable. On the other hand, a business selling high-end furniture or heavy machinery will naturally have a much lower number, and that's perfectly normal.
The best way to figure out your ideal number is to do two things:
- First, take a look at your direct competitors. Benchmarking against them gives you a solid feel for where you stand in the market.
- More importantly, track your own ratio over time. Are you improving month over month? Quarter over quarter? That consistent upward trend is your real goal.
Can an Inventory Turnover Ratio Be Too High?
You bet it can. A crazy-high ratio might seem like a sign of incredible efficiency, but it's often a red flag. It usually means your inventory levels are too lean and you're constantly on the verge of running out of stock.
When that happens, you're not just losing a sale; you're risking losing a customer for good. The goal is to find that sweet spot—a healthy turnover that keeps cash flowing without disappointing customers with "out of stock" signs.
Think of an extremely high turnover ratio as running a race at an unsustainable sprint. You might be winning for now, but you're at high risk of burning out—or in this case, running out of product.
How Often Should I Calculate My Inventory Turnover Ratio?
For official financial reporting, most businesses calculate it annually. But if you wait a full year to check in, you're leaving valuable insights on the table.
I always recommend calculating it at least quarterly, if not monthly. This gives you a much clearer, more immediate picture of your inventory health. Catching a downward trend early lets you adjust your ordering and sales strategies before a small hiccup turns into a major headache.
Ready to take control of your inventory and make data-driven decisions with ease? Biyo POS provides the real-time sales and inventory data you need to calculate and optimize your turnover ratio effortlessly. Discover how Biyo POS can transform your business today.