A point of sale report is so much more than a simple record of what you’ve sold. Think of it as the story of your business—told through data. It takes all the raw numbers from every sale, refund, and customer interaction and weaves them into a clear picture of your business's health.
From Daily Sales to Smarter Decisions
Ever feel like you're running your business on guesswork? It's a bit like trying to navigate a ship in the fog without a compass. That's what it feels like to operate without good POS reports.
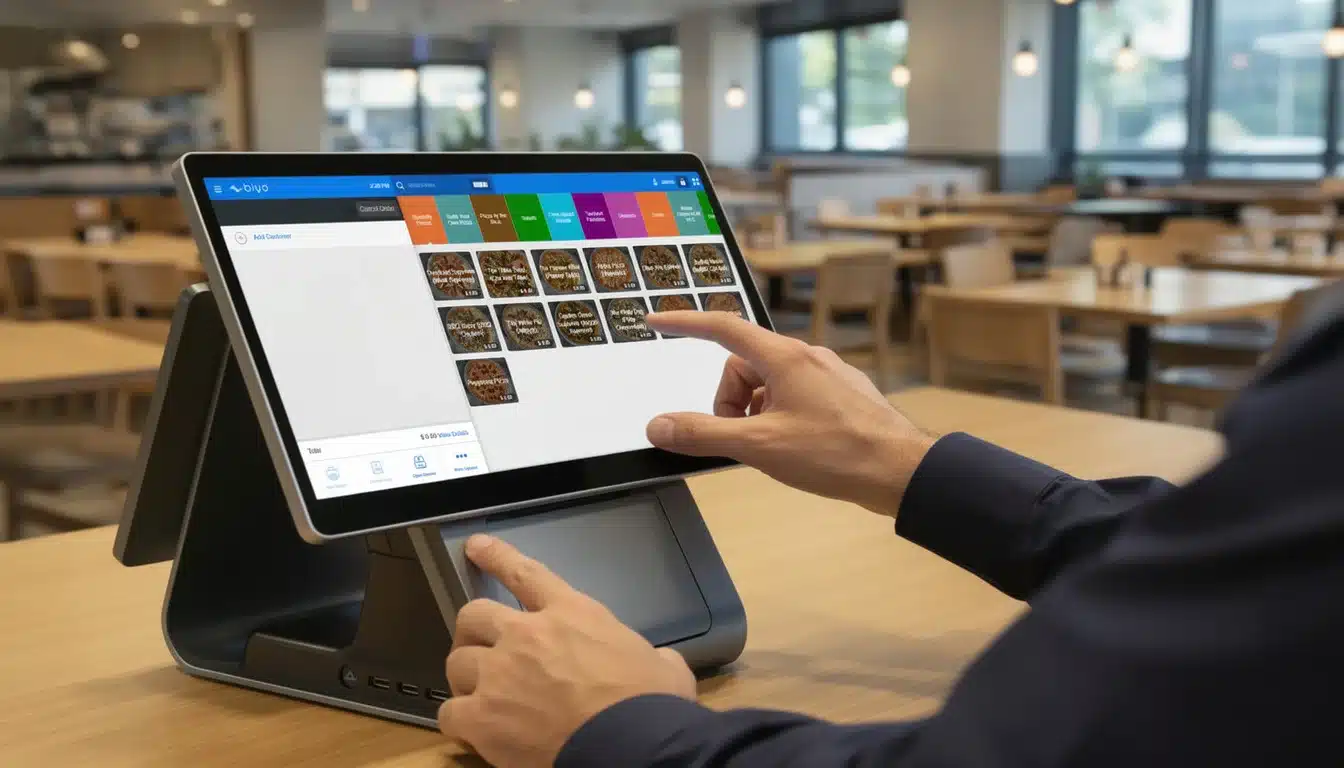
Many business owners treat their POS system like a high-tech cash register, but it's really a powerful data hub. It’s sitting on a goldmine of information, revealing crucial details like your sales trends, best-selling products, and busiest hours of the day.
When you start digging into that data, you can finally stop guessing and start making confident, informed choices that boost your bottom line. These reports are the key to turning your daily transaction logs into a real strategic advantage.
The demand for these powerful tools is exploding for a reason. The global point of sale market was valued at USD 33.41 billion in 2024 and is projected to skyrocket to USD 110.22 billion by 2032.
Why POS Data Matters
A point of sale report is essentially your business's health chart. It helps you pinpoint what's working well, diagnose what isn't, and uncover hidden opportunities for growth you might have otherwise missed.
- Spot Trends: Instantly see which products are flying off the shelves and which ones are just collecting dust. This is your key to smarter inventory management.
- Understand Customers: Find out who your most loyal customers are and what they love to buy, which lets you create marketing offers they can't refuse.
- Optimize Operations: Identify your peak hours to schedule staff perfectly, ensuring you deliver amazing service without wasting money on labor costs.
Embracing a culture of data-driven decision-making in vending operations is key to transforming daily sales figures into strategic advantages.
This is where you make the leap from simply reacting to problems to proactively building a better business. The information locked away in your POS system gives you the power to build a more resilient and profitable operation.
Understanding the benefits of POS data is the first step. This guide will show you exactly how to read, interpret, and act on the insights these reports provide.
Decoding the Most Important POS Reports
Not all reports are created equal. Staring at a wall of data can feel like you're trying to drink from a fire hose. The real trick is knowing which point of sale report to focus on to get the insights that actually move the needle for your business.
Think of these reports less like boring spreadsheets and more like specialized dashboards in your business's control room. Each one gives you a crystal-clear view of a different, vital part of your operations.
The industry itself shows just how critical these tools have become. The global point-of-sale terminal market was pegged at USD 113.38 billion in 2024 and is on track to hit an incredible USD 181.47 billion by 2030. That’s not just growth; it's a testament to how essential POS data is for any modern business trying to compete.
This infographic breaks down the journey from a simple, raw transaction to a powerful report that helps you make smarter decisions.
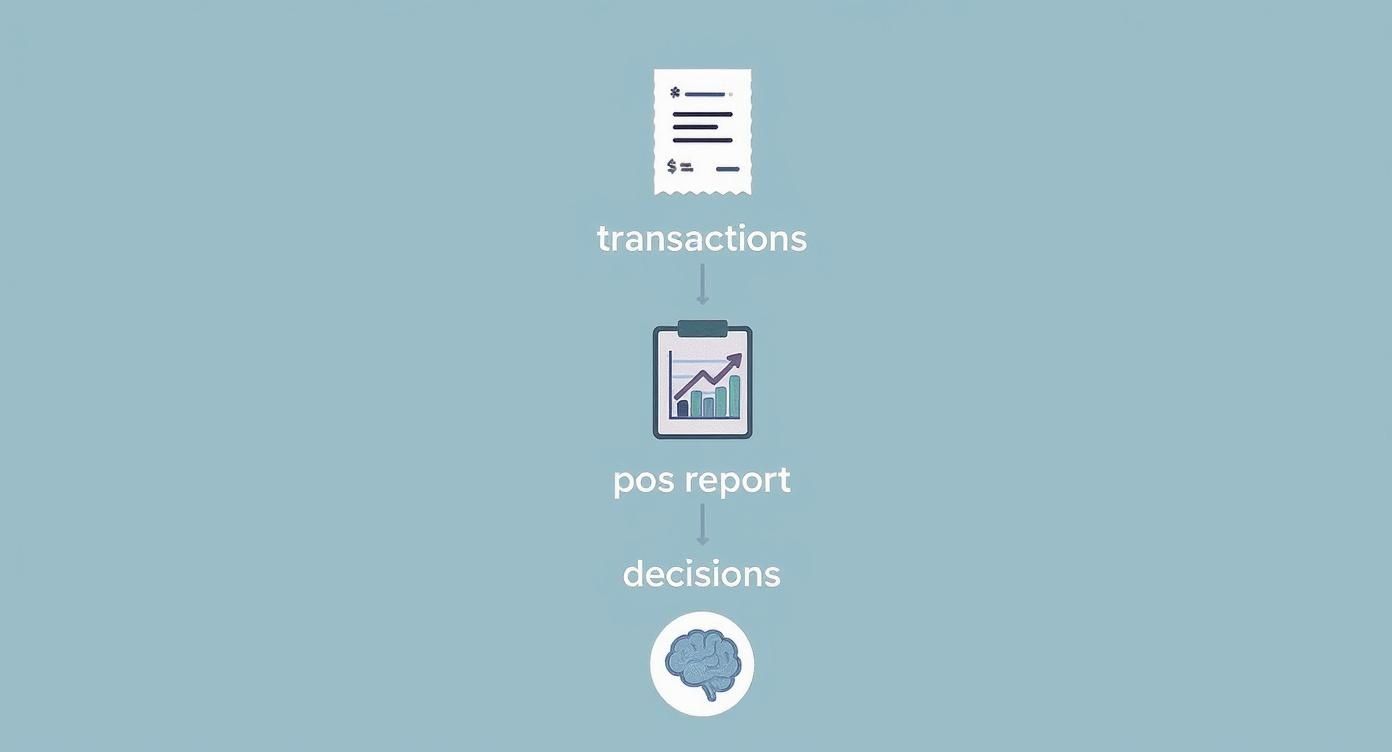
The whole point is to stop just collecting sales data and start understanding the story it’s telling you about where your business is today—and where it could be tomorrow.
To help you get started, here’s a quick overview of the most common reports you'll encounter and what they can tell you.
Essential Point of Sale Reports at a Glance
| Report Type | Key Metrics Included | Primary Business Question Answered |
|---|---|---|
| Sales Summary | Total Sales, Net Sales, Average Transaction Value (ATV), Sales by Time Period | "How are we performing financially, and when are we busiest?" |
| Inventory | Stock on Hand, Item Sell-Through Rate, Low-Stock Alerts, Dead Stock | "What's selling well, what's not, and what do I need to reorder?" |
| Customer Behavior | Purchase History, Visit Frequency, Total Spend, Loyalty Program Data | "Who are my best customers, and what do they like to buy?" |
| Employee Performance | Sales per Employee, Items per Transaction, Table Turnover Rates | "Who are my top-performing team members, and who might need support?" |
Each of these reports offers a unique lens through which to view your business, turning abstract numbers into actionable strategies. Let's dig a bit deeper into each one.
Sales Summary Reports: Your Revenue Cockpit
First up is the sales summary, the most fundamental point of sale report of them all. At its core, it answers that all-important question: "How much money did we actually make?" But a good report tells you so much more than just a single number.
It slices and dices your total sales by the day, week, or month, making it easy to spot trends and see if you're hitting your targets. You’ll also find key metrics like Average Transaction Value (ATV), which tells you what a typical customer spends per visit. That single number gives you a clear baseline to work from when you're thinking about upselling or creating product bundles.
Inventory Reports: Your Product Performance Dashboard
Nothing kills profits faster than poor inventory management. It’s a silent drain on your resources. Think of inventory reports as your first line of defense, showing you which products are flying off the shelves and which are just collecting dust.
These reports are absolutely crucial for preventing embarrassing stockouts on your bestsellers while also helping you avoid tying up cash in slow-moving items. A fantastic metric to watch is the item sell-through rate, which calculates how fast a product sells compared to the quantity you ordered. Tracking this helps you shift from making purchasing decisions based on gut feelings to making them based on hard data. You can get a deeper understanding of these metrics in our guide explaining what POS data is and how it helps with smarter sales tracking.
Customer Reports: Your Guide to Your Best Buyers
Do you really know who your most valuable customers are? Your customer reports have the answer. By analyzing purchase history, these reports can pinpoint your most frequent and highest-spending shoppers. That information is pure gold for your marketing.
When you understand what your best customers buy and when they shop, you can stop wasting money on generic ads. Instead, you can create targeted loyalty programs and special offers that actually resonate, encouraging more repeat business and boosting their lifetime value.
Employee Performance Reports: Your Team Scoreboard
Finally, don't forget about your team. Employee performance reports act as a scoreboard, tracking sales generated by each staff member. This quickly helps you spot your top performers—the ones who might be perfect for training new hires.
On the flip side, it also shows you who might need a bit more coaching or support. For a restaurant, this report can even track things like table turnover rates, giving you the insights you need to build more efficient staff schedules and improve the customer experience during your busiest hours.
How to Find the Story Hidden in Your Data
Having a point of sale report is one thing; truly understanding the story it tells is the key to unlocking real business growth. Raw data is like a pile of puzzle pieces. Your job is to put them together to see the bigger picture—your business performance, customer habits, and opportunities you never knew you had.
This means you have to go beyond just glancing at the numbers. Sure, you might notice sales spike every Friday. That's a good start, but the real magic happens when you dig deeper to find out why. What specific items are flying off the shelves? Are new customers buying them, or is it your regulars? This is how you start to piece together the narrative hidden in the numbers.
Spotting Trends and Patterns
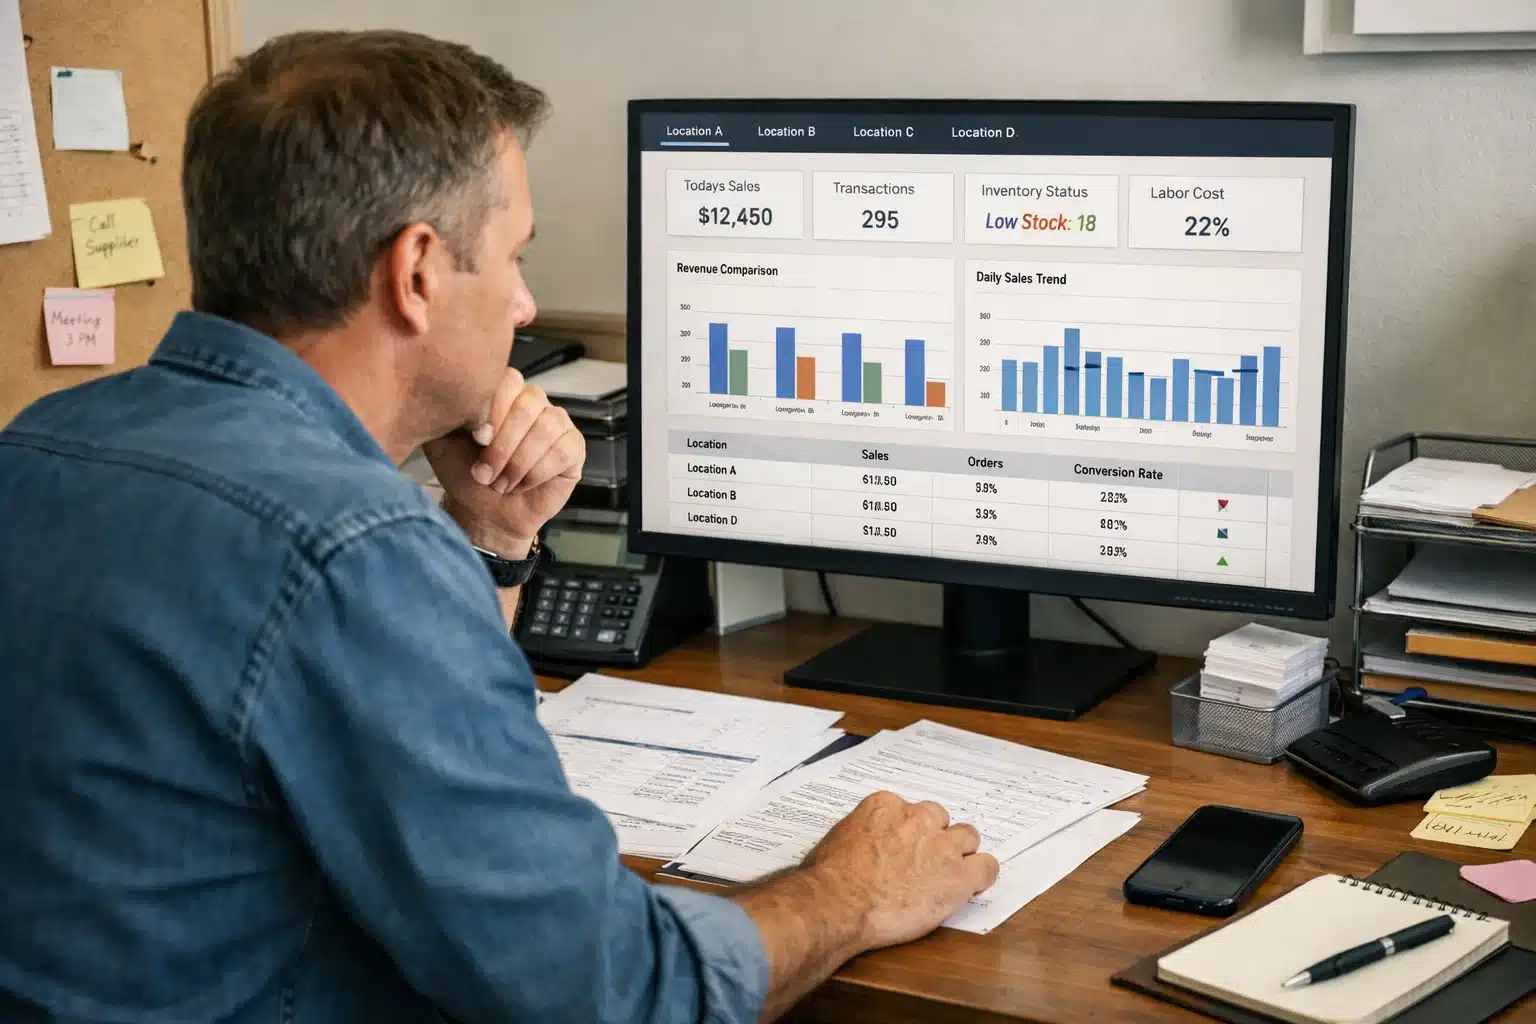
The first step in making sense of your data is simply looking for patterns. A modern POS system like Biyo lays this all out on a clean dashboard, so you can spot trends without needing a degree in data science.
The dashboard above gives you a quick visual on your key metrics, showing how net sales, transaction counts, and customer numbers fluctuate. By comparing different timeframes—this week versus last week, or this April versus last April—you can immediately see if you're growing, stalling, or slipping. It’s this basic comparison that forms the bedrock of any real strategy.
For instance, if you see a steady climb in your Average Transaction Value (ATV), it could be a great sign that your team's upselling techniques are working. On the flip side, if sales took a nosedive on a day you expected to be busy, that's a red flag worth exploring. Was it terrible weather? A competing local event? Or something else entirely?
Your POS data doesn't just show you what happened; it provides the clues to understand why it happened. This insight allows you to replicate successes and avoid repeating mistakes.
Turning Insights Into Actionable Questions
Good data analysis isn't about having all the answers—it's about asking the right questions. Your reports are there to give you the answers, but you have to know what to ask first.
Start by framing your analysis around these simple but powerful questions:
- How did we do then vs. now? Compare sales data across different time periods. Did that marketing campaign you ran last month actually move the needle on sales? Looking at two different periods side-by-side gives you a clear sense of your return on investment.
- What's moving and what's not? Your inventory report is your best defense against the twin profit killers: overstocking and understocking. If an item has a painfully low turnover rate, it’s just dead weight tying up your cash. Maybe it's time for a promotion, or maybe it's time to say goodbye to that product.
- Who are our best customers? A customer report will point you straight to your VIPs—the people who spend the most and visit most often. Once you know who they are, you can create targeted loyalty offers that make them feel valued and keep them coming back for more.
By making a habit of asking these questions, your point of sale report transforms from a boring spreadsheet into your most valuable strategic tool. You’re no longer just counting sales; you’re reading the story of your business and writing its next chapter.
Turning POS Insights Into Profitable Actions
Looking at a report is one thing; doing something with it is another. A point of sale report is packed with incredible information, but it's just a bunch of numbers until you use it to make smart decisions that actually grow your business. It's time to connect the dots between what the data says and what you do next.
Think of it as creating simple "if this, then that" rules for your business. For example, if your POS report shows that a popular product is always sold out days before your next shipment arrives, then the obvious move is to increase your order size or frequency. It's this direct line from insight to action that separates the businesses that thrive from those that just survive.

The market itself tells the story of how vital these systems have become. Valued at USD 11.03 billion in 2024, the point-of-sale software market is expected to more than double to USD 24.35 billion by 2033. Why? Because businesses everywhere are realizing that good data is the foundation of smart operations, a shift you can see reflected in current retail POS trends.
Smart Inventory Management
Your inventory report is basically a treasure map for improving your cash flow. If you're overstocked, your money is just sitting on a shelf collecting dust. If you're understocked, you're leaving money on the table and disappointing customers.
-
If: The report highlights a pile of "dead" stock that hasn’t moved in months.
-
Then: It's time for action. Run a flash sale, bundle it with a popular item, or mark it down to clear it out. This frees up cash and makes room for products that actually sell.
-
If: You spot a few items flying off the shelves with a high sell-through rate.
-
Then: Order more of them. Don't be shy. Maybe even give them a prime spot in your store or at the top of your menu to capitalize on the momentum.
Boosting Sales and Staff Performance
Your sales and employee reports are a powerful combination for figuring out how to increase what each customer spends. A low average transaction value (ATV) isn't just a statistic; it's a flashing red light telling you there's an opportunity.
If you notice your ATV is lower than you'd like, the first place to look is your team. Are they upselling? Are they cross-selling? A little training can go a long way. A simple suggestion at the checkout counter can make a huge difference to your daily numbers.
This strategy empowers your staff to be more than just cashiers—they become valuable members of your sales team. You can also get creative by offering product bundles or combo deals that give customers a better value and nudge them to spend a little more, giving your ATV a direct boost.
Refining Marketing and Customer Relationships
Who are your best customers? What do they love to buy? Your customer reports have the answers, letting you finally stop guessing with your marketing efforts.
- Find Your VIPs: Your POS can instantly show you the top 5% of customers who bring in a huge chunk of your revenue. These are your most important people.
- Create Targeted Offers: Treat them like the VIPs they are. Build a loyalty program just for them, offering exclusive discounts or first dibs on new arrivals.
- Personalize Promotions: See a group of customers who always buy the same thing? Send them a targeted email about a new, related product you think they'll love. It feels personal because it is.
For restaurants, this kind of data is gold. It’s the key to running a tighter ship and boosting profits. You can dive deeper into these strategies in our guide on how restaurant data analytics tools maximize efficiency.
By making every data point from your POS report trigger a specific, measurable action, you build a powerful cycle of improvement that keeps you ahead of the competition.
Best Practices for Effective POS Reporting
Getting the most out of your data isn't about pulling a report once in a blue moon. The real magic happens when you build a consistent and effective reporting process. A point of sale report becomes a true game-changer when it’s part of your daily operations, guiding your decisions instead of just sitting there.
Think of it like giving your business a regular check-up. Establishing a rhythm for reviewing your data gives you a complete picture of its health, from the daily pulse to the long-term trends.
Establish a Regular Reporting Rhythm
A structured schedule is your best friend here. It ensures you're looking at the right data at the right time, so you don't get bogged down in daily minutiae or miss the bigger picture.
-
Daily Checks: This is all about immediate operational health. At the end of each day, pull your reports to check on cash flow, see how sales stacked up against your targets, and make sure all payments are reconciled. It's a quick check-in to keep your financial foundation solid.
-
Weekly Reviews: Use your weekly data to spot short-term patterns. Are Tuesdays always slow? Did that weekend promotion actually bring people in? This is the perfect time to analyze sales trends and tweak things like staff schedules or inventory for the week ahead.
-
Monthly Deep Dives: Your monthly reports are for stepping back and thinking strategically. This is where you dig into inventory turnover, evaluate employee performance, and see how your customer loyalty programs are doing. These bigger insights help you make smarter decisions on purchasing, marketing, and future goals.
When you consistently review your POS data, you start building a data-driven culture. Your team stops making decisions based on gut feelings and starts relying on hard evidence—and that’s how you build a business that can really grow.
Customize and Automate for Efficiency
Let's be honest, your time is your most valuable asset. Manually pulling the same reports day after day just isn't a good use of it. Modern POS systems like Biyo are built to do the heavy lifting for you, freeing you up to focus on what the numbers actually mean.
A great first step is to customize your POS dashboard. Put your most important Key Performance Indicators (KPIs)—like net sales, average transaction value, and gross profit margin—right where you can see them. This gives you an instant snapshot of your business's health the moment you log in.
Even better, put automation to work. With a system like Biyo, you can schedule key reports to be generated and emailed to you automatically. Imagine waking up to your daily sales summary or getting a weekly low-stock alert without having to do a thing. Automation ensures you never miss a critical insight and makes effective reporting a seamless part of your day.
Common Questions About Point of Sale Reports
As you start digging into your POS data, you're bound to have some questions. It's totally normal. Let's tackle a few of the most common ones that business owners ask, so you can start putting your reports to work right away.
How Often Should I Run Reports?
There’s no single magic number here—it really comes down to what you’re trying to accomplish. The best approach is to think about it in layers, giving you different views of your business's health.
It’s a bit like checking your vital signs.
- Daily: Think of this as your daily pulse check. Running end-of-day reports helps you confirm cash flow, make sure all your payments are reconciled, and see how the day went. It's essential for keeping operations smooth.
- Weekly: This is your chance to spot short-term trends. A weekly look at sales and inventory can help you make smart calls on staffing for the upcoming week or decide if a promotion needs a little tweak.
- Monthly: Now you’re zooming out for the big picture. Monthly reports are perfect for tracking strategic goals, like customer retention and overall profitability, which guide your long-term planning.
The key is to build a consistent routine. When you do, checking reports stops feeling like a chore and becomes a powerful habit that fuels growth.
What Is the Most Important POS Metric?
Every business has its own unique quirks, but for most retail and restaurant owners, it almost always boils down to two heavy hitters: Net Sales and Gross Profit Margin.
Net sales is your true revenue—what you've actually earned after all the returns and discounts are factored in. It’s the real number. On the other hand, gross profit margin tells you how much money you’re actually making on the things you sell. It’s a direct measure of your profitability.
Watching these two metrics together gives you a quick, powerful snapshot of your financial health. One shows how much cash is coming in the door, and the other shows how good you are at keeping it.
Can POS Reports Improve My Marketing?
Oh, absolutely. Your customer reports are basically a treasure map for smarter marketing. When you start analyzing what people buy and how often they visit, you can finally stop guessing and start building campaigns that actually work.
For instance, your point of sale report can pinpoint your top 5% of customers—your absolute VIPs who are likely driving a huge chunk of your revenue. Why not create a special loyalty program just for them? The data also reveals which products people tend to buy together, handing you a perfect idea for a new product bundle or a targeted promotion.
Ready to stop guessing and start growing? Biyo POS transforms your daily sales data into a clear roadmap for success. With customizable dashboards and automated reporting, you get the insights you need to boost profits, optimize inventory, and build customer loyalty. Start your free 14-day trial today!