A restaurant income statement lays out your revenue, cost of goods sold, labor, operating expenses, and profit in one clear snapshot. Think of it like a restaurant’s performance report card. For a full-service operation, you might see around $250,000 in monthly sales, with about 30% spent on wages and 28–35% on ingredients.
Overview Of Restaurant Income Statement Example
This high-level view helps restaurant operators spot profit drivers at a glance and set smarter budgets. By comparing monthly and annual figures side by side, you can zero in on areas where costs creep up.
Quick View Of Monthly And Annual Statement
Below is a concise table summarizing key line items for both a single month and the full year. Use it to benchmark your own performance quickly.
| Line Item | Monthly Value | Annual Value |
|---|---|---|
| Total Revenue | $250,000 | $3,000,000 |
| Cost of Goods Sold | $70,000 | $840,000 |
| Labor Expenses | $87,500 | $1,050,000 |
| Operating Expenses | $30,000 | $360,000 |
| Net Profit | $10,000 | $120,000 |
This snapshot gives you a bird’s-eye view of where your dollars flow over four weeks versus twelve months. It’s a handy reference when you’re reviewing financial health with your team.
Key Line Items Explained
- Revenue covers every sale before discounts or refunds.
- Cost of Goods Sold (COGS) tracks ingredient costs, usually around 28–35% of sales.
- Labor Expenses include wages, payroll taxes, and benefits—often 30–35% of your top line.
- Operating Expenses account for rent, utilities, marketing, and other overhead.
- Net Profit shows what remains after all expenses—often squeezed into single digits.
Imagine running a busy downtown bistro that pulls in $250,000 each month, with $70,000 in COGS and $87,500 in labor. Your gross profit sits around 65–72%, but your bottom line might only be 3–5% (roughly $7,500–$12,500). That tight margin is why every dollar counts. For more context, check out industry data from Apicbase.
Net profit margins often shrink to single digits, highlighting the importance of vigilant cost control.
How To Interpret This Snapshot
- Use monthly vs. annual comparisons to spot seasonal swings.
- Adjust menu prices based on clear gross profit percentages.
- Plan staffing levels by identifying high-cost labor periods.
- Forecast cash flow by projecting your net profit over a year.
Visual summaries reduce analysis time by up to 50%, helping managers react faster.
Next Steps With Detailed Analysis
- Export your POS data and map it to each line item in this table.
- Pull vendor invoices to verify COGS and uncover hidden fees.
- Automate data extraction with Biyo POS to update your statement in real time.
- Review and adjust your budget monthly, using this template as your baseline.
In the next section, we’ll dive into the step-by-step process of building your own income statement—from raw POS exports to a polished report that drives informed decisions.
Understanding The Key Components
When you set out to build your restaurant income statement, it’s crucial to understand each element that drives your profitability. Revenue recognition isn’t about when the cash lands in your account—it’s about when you actually earn that $100 from a pizza order. That timing affects everything from tax filings to performance analysis.
Revenue Recognition Explained
Revenue flows through three main channels: dine-in, takeout, and delivery. Breaking out each stream helps you pinpoint what’s fueling growth and where to focus your marketing dollars.
For instance, a neighborhood bistro might see 60% of its $80,000 weekly sales come from dine-in, 30% from takeout, and 10% from delivery. By locking in sales at order fulfillment, you avoid the headaches of mismatched reporting periods.
Accrual basis reporting records revenue when the meal is served. Cash basis waits until the money hits your bank. Choosing accrual gives you a truer view of day-to-day performance—no timing quirks.
Tips for Accurate Revenue Capture
- Reconcile end-of-day POS summaries with bank deposits
- Audit third-party delivery invoices for hidden fees
- Account for gift card redemptions and loyalty-program rewards
Cost Of Goods Sold Insight
Think of COGS as the ingredients you “spend” to bake your revenue cake. It covers raw materials, packaging, and prep costs tied to dishes sold.
To calculate:
- Start with ending inventory from the previous period
- Add purchases made during the current period
- Subtract ending inventory at period close
If you bought $20,000 in produce and proteins and closed with $5,000 in stock, your COGS sits at $15,000. This clarity lets you adjust portion sizes or shop around for better suppliers.
Accurate COGS monitoring can boost profit margins by up to 5%.
COGS Best Practices
• Track yield percentages on proteins
• Log spoilage and theft separately
• Use barcode scanners for precise usage data
Labor And Overhead Costs
Labor expenses include wages, payroll taxes, benefits, and tip distributions. Track full-time, part-time, and tip pools to spot staffing pressure points. Extras like shift differentials and overtime add complexity.
Overhead covers rent, utilities, marketing, insurance, and licensing. A quick rule of thumb: rent should hover around 8–12% of sales.
Key Overhead Items
- Rent: 8–12% of sales
- Utilities: gas, water, electricity
- Marketing: social media, local ads
- Insurance & Licensing: liability, permits
Scheduling software can help match labor spend to peak service times, reducing unnecessary payroll spikes.
Calculating Profit Margins
Gross profit = Revenue − COGS. Most full-service restaurants aim for a 65%–75% gross margin. Net income then subtracts labor and all operating costs.
| Measure | Formula |
|---|---|
| Gross Profit | Revenue − COGS |
| Net Income | Gross Profit − Labor − Expenses |
Comparing these figures reveals whether your menu pricing is on point or if cost controls need tightening. Every dollar you save on ingredients or shifts goes straight to your bottom line.
Margin Monitoring Tips
- Track prime cost percentage each month
- Set alerts when prime cost tops 65%
- Review weekly labor variances
A clear, annotated income statement lets you spot rising COGS or labor spikes before they erode profit. Next, we’ll dive into restaurant-specific P&L items like waste allowances and loyalty discounts.
Up next: Restaurant-Specific Line Items and Best Practices
Explaining Restaurant Specific Line Items
Restaurants have P&L categories you simply won’t see in retail or manufacturing—things like spoilage, portion variances and cash mismatches can throw off your true profit if they aren’t tracked.
- Inventory Adjustments record stock write-offs for spoilage or theft, keeping COGS accurate.
- Waste Allowances reserve a slice of raw ingredients for natural prep losses.
- Daily Cash Sales Tracking aligns physical cash with POS totals, flagging any gaps.
- Credit Card Fees shave off roughly 2%–3% of sales for processing.
- Franchise Royalties often run 4%–6% of gross revenue.
- Menu Promotions log discounts separately so you can measure their real effect.
- Gift Card Breakage recognizes unredeemed balances as income, fine-tuning forecasts.
Inventory Adjustments And Waste Tracking
When spoilage or theft hits, you write off inventory—and it goes straight into COGS. That way, you avoid overstating profits after a busy weekend.
Waste allowances act as a buffer for prep scraps and portion inconsistencies. By setting a monthly allowance, you prevent surprise cost spikes and price menus more confidently.
Best Practices
- Conduct cycle counts weekly.
- Post adjustment entries immediately after audits.
- Analyze waste by item and shift.
Handling Promotions And Loyalty Discounts
Treat promotions as contra revenue—separate from your full-price sales. Loyalty discounts can land under marketing expenses or contra revenue, depending on your accounting policy.
By creating dedicated accounts, you’ll see at a glance which campaigns drive traffic and which need a tweak.
Keeping discounts out of core sales gives you a clear view of promotional ROI.
Tips
- Assign unique codes for each offer.
- Reconcile loyalty redemptions weekly.
- Compare discounted vs. full-price transactions.
Applying Quick Service Benchmarks
Imagine a quick-service outlet pulling in $1.2 million a year—right in line with U.S. market volumes. According to restaurant industry statistics, the sector hits about $1.6 trillion annually.
| Metric | Percentage | Dollar Amount |
|---|---|---|
| COGS | 25–30% | $300,000 |
| Labor | 25–30% | $360,000 |
| Net Profit | Up to 10% | $120,000 max |
Most quick-service spots settle around 3–6% net profit, but the most efficient can push near 10%. Delivery commissions and card fees will tighten margins, so efficiency is everything.
Check out our guide on mastering cost of goods sold (COGS) and boosting profit margins with Biyo POS for tips on automated COGS analysis.
Tracking Cash And Royalties
Reconciling daily cash with POS reports prevents shrinkage surprises. At day’s end, deposit the receipts and compare them to your system. If anything exceeds your variance threshold, dig in immediately.
- Tabulate end-of-day cash totals.
- Match deposit records against POS summaries.
- Investigate any discrepancies without delay.
Franchise royalties accrue each month per your contract rate. Record them as operating expenses to reflect each outlet’s true profitability. With Biyo POS, you can automate both cash reconciliation and royalty accrual—freeing managers to focus on service rather than spreadsheets.
Accounting Gift Card Breakage
Estimating gift card breakage turns unredeemed balances into other income. Use historical redemption data to calculate likely breakage, then log it under GAAP to sharpen your revenue picture.
Mastering these restaurant-specific line items gives you crystal-clear cost visibility and tighter margin control. Next up: allocate shared expenses across departments so every dollar has a home on your P&L.
Building Your Income Statement From POS Data
Turning raw POS exports into a polished profit & loss statement can feel like solving a puzzle. Yet once the pieces click, you gain insights that drive smarter decisions. Here’s how to take daily sales and cost figures from your POS and sculpt them into a restaurant income statement you can rely on.
It all begins with pulling your POS data—sales, payment types, even voids. From there, you’ll match deposits to bank records, categorize every expense, and roll it all up into monthly or annual totals.
- Export daily sales and transaction logs for your chosen period.
- Reconcile cash, card, and third-party deposits against bank statements.
- Adjust for voids, comps, and loyalty discounts.
- Map vendor invoices directly to cost of goods sold entries.
- Aggregate all items by category—month and year.
This simple routine transforms scattered numbers into a smooth, polished statement.
Exporting POS Data
Starting with a proper export from your POS is crucial. Aim for CSV or Excel so nothing slips through the cracks.
Include modifiers, discounts, and tips fields to capture every cost nuance. Missing these can leave you with blind spots later.
- Timestamps and server IDs for each order
- Discount and comp codes to link promotions
- Tip totals to allocate labor costs accurately
Before closing the period, record an inventory snapshot at the start and end dates. That way, your COGS adjustments stay rock-solid.
“Accurate exports reduce reconciliation time by up to 50%.”
Reconciling Payments And Adjustments
Each day, match your POS summary to actual deposits on your bank statement. It might sound tedious, but catching missing tips, refunds, or fees early saves headaches later.
- Compare bank statements with end-of-day summaries
- Correct for voids and complimentary meals
- Tag loyalty and discount entries separately
- Link merchant statements back to POS reports
- Deduct processing fees before logging revenue
A quick till count against POS cash totals will catch register shortages on the spot. These tweaks ensure your revenue figures mirror real sales.
Aggregating And Categorizing Line Items
Once everything’s reconciled, group each transaction by major cost category. This lays out a crystal-clear view of food costs, labor, rent, and beyond.
Leverage pivot tables or built-in reports to slice by menu section or service channel. A quick chart each month helps you spot spikes before they become problems.
| Category | Monthly Total | Annual Total |
|---|---|---|
| Food | $70,000 | $840,000 |
| Labor | $87,500 | $1,050,000 |
| Rent | $8,000 | $96,000 |
| Utilities | $2,500 | $30,000 |
And don’t forget to filter out any big one-off events—catering or private bookings can skew your trends.
- Chart food cost percentage monthly
- Compare labor percent against prime cost targets
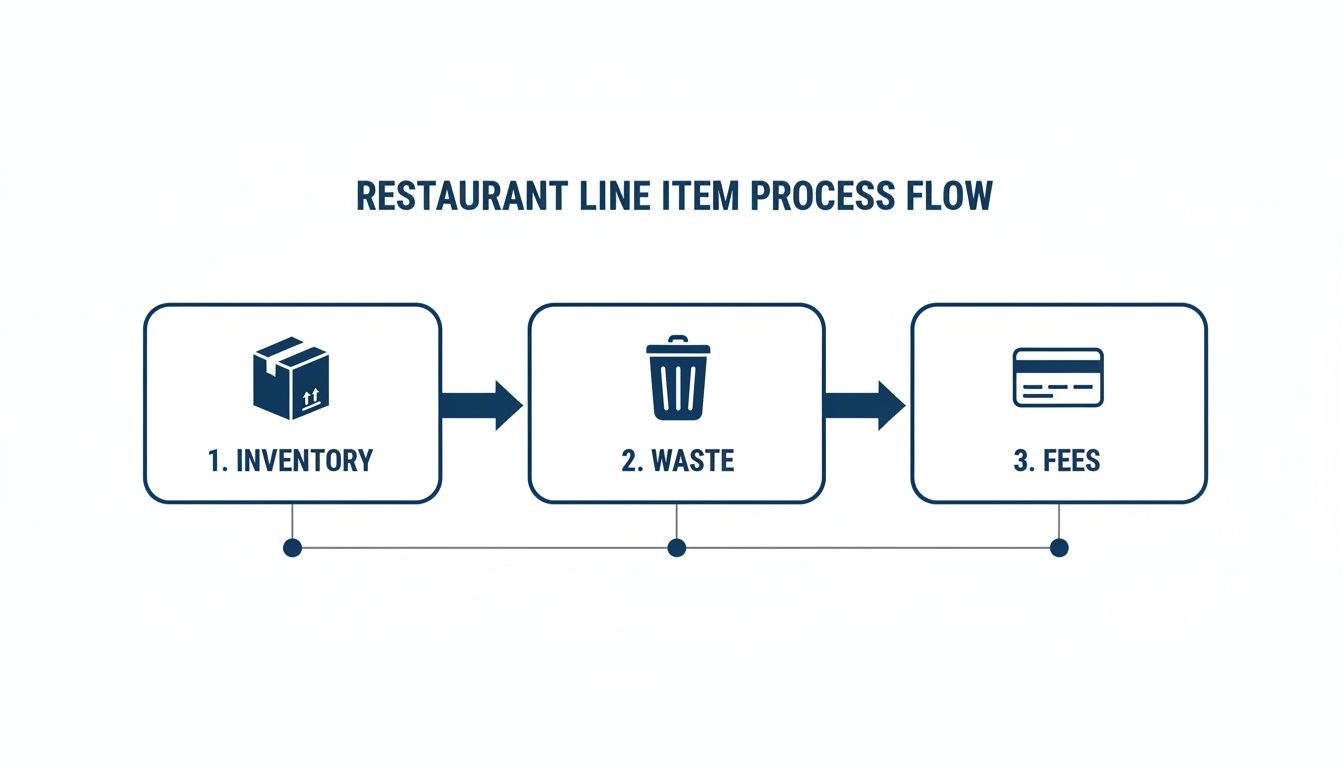
Below, you’ll find a quick visual showing how inventory, waste, and processing fees feed into your P&L.
Automating With Biyo POS
Once you’ve nailed the manual process, let Biyo POS handle the heavy lifting. Its built-in tools automate exports, categories, and reconciliation rules—so you can focus on running the restaurant.
Learn more about capturing and using POS data in our guide on smarter sales tracking with POS data definitions.
Dashboards update in real time to flag budget variances. And with role-based access, managers can review draft statements before final approval.
- Schedule daily exports to run automatically
- Assign cost-center tags to each menu item
- Set up auto-reconciliation rules for payments
- Generate monthly P&L reports with one click
- Control user permissions for data integrity checks
For example, one busy cafe cut its month-end close from three days to just two hours by following this workflow. Block a monthly spot check in your calendar to keep everything aligned.
Pro Tip: Automate CSV imports into your accounting system to eliminate copy-paste errors.
With Biyo POS, you’ll have a reliable income statement in hours instead of days. Treat it as a living document—fine-tune pricing, staffing, inventory, and marketing on the fly as you grow.
Benchmark Ratios For Restaurant Income Statements
Running your restaurant without checking the numbers is like steering a ship without a compass. When you stack your key ratios beside industry norms, you get a clear map of where to tighten costs and where to push for growth.

How To Calculate Each Ratio
Before you can compare, you need to calculate:
- Gross Profit Margin: (Revenue − COGS) ÷ Revenue
- Labor Cost Percentage: Total wages, taxes and benefits ÷ Revenue
- Prime Cost: (COGS + Labor Cost) ÷ Revenue
- Net Profit Margin: Net Profit ÷ Revenue
For instance, if your revenue is $100,000 and COGS sits at $30,000, your gross profit margin is 70%. If labor expenses are $30,000, that’s 30% of sales. From there, prime cost would be (30,000 + 30,000) ÷ 100,000 = 60% of revenue.
Prime cost often exceeds 60% in full-service operations, making it the biggest pressure point.
Benchmark Metrics For Full Service And Quick Service
Here’s a quick side-by-side look at four essential ratios. Use this as a checkpoint for your own numbers:
Benchmark Metrics For Full Service And Quick Service
| Metric | Full Service | Quick Service |
|---|---|---|
| Revenue % | 100% | 100% |
| COGS % | 35% | 25% |
| Labor % | 32% | 28% |
| Net Margin % | 4% | 9% |
Even a small gap in COGS or labor can swing your net margin dramatically. Quick-service spots often enjoy higher profitability simply by keeping prime costs tighter.
How To Interpret Results
When your gross profit margin slips below 60%, it may be time to renegotiate with suppliers.
Labor costs north of 35% usually point to scheduling hiccups or rising wages.
If table turnover slows, check your seating plan or service flow.
To turn these insights into action:
- Pull monthly ratios from your POS using Biyo POS dashboards.
- Match each ratio against the benchmarks above and flag any outliers.
- Set incremental goals—cut prime cost by 2%, for example.
- Track changes weekly and tweak staffing or pricing as needed.
Setting Realistic Targets
Start small. A 1–2% improvement each quarter feels manageable and adds up fast.
- Automate ratio tracking and alerts in Biyo POS.
- Link seating strategies to table turnover goals.
- Scan historical POS exports to spot seasonal swings in labor spend.
- Review and update targets every three months.
Consistent check-ins keep your team focused and your bottom line climbing.
Case Study Example Overview
A neighborhood café in Austin watched its numbers for six months.
- They renegotiated rates with two main suppliers, cutting COGS by 5%.
- Staff schedules were optimized, dropping labor cost percentage by 3%.
- Net profit margin grew from 5% to 8%, adding roughly $4,500 to monthly profits.
Key takeaways:
- Renegotiate supplier contracts quarterly.
- Align staffing with peak hours (especially weekend brunch).
- Adjust menu prices based on prime cost data.
By using Biyo POS to capture and compare these ratios every day, they turned raw data into a clear path for growth. Regularly measure, compare year-over-year, and let these benchmarks guide each decision.
Automating Income Statement Reporting With Biyo POS
Building a restaurant income statement by hand often feels like battling a spreadsheet beast.
Biyo POS swaps out those tedious exports for real-time insights, updating your P&L the moment sales and costs post.
Setting Up Scheduled Exports
You can schedule P&L reports to run automatically every day or month. Choose CSV, Excel, or PDF for seamless uploads into your accounting software.
- Daily Sales Reports track revenue, voids, and discounts by shift
- COGS Exports break down inventory usage by category
- Labor Summary compiles wages, tips, and taxes in one file
- Variance Alerts flag cost or sales gaps above your set threshold
Linking Cost Centers And GL Accounts
Tag menu items, payments, and labor entries with cost centers—then map each tag to the matching General Ledger account. Your food cost, labor, and overhead always land in the right bucket.
- Create cost centers for food, labor, and overhead
- Assign GL codes that mirror your chart of accounts
- Run a test export and verify each line
- Tweak tags if an entry falls into the wrong account
Customizable P&L Templates
Biyo POS comes with built-in templates you can edit on the fly. Rename line items, shuffle sections, or add footnotes to explain unusual figures.
- Support for multiple currencies and tax codes across locations
- Option to lock a template so teams can’t overwrite your setup
- Export as PDF for sharing with non-accounting staff
Save each location’s template to keep quarterly reports consistent and simplify your detailed analysis.
Generating Monthly Statements With One Click
When the month wraps up, skip the manual number crunch. Hit “Generate Monthly P&L” and Biyo POS gathers every revenue and cost line for you.
The dashboard highlights a 65% gross profit margin and a 30% labor cost percentage trend.
- Food cost percentages graphed over time
- Labor variances turn red when above 35%
- Monthly net profit sits alongside your targets
Using Real Time Dashboards
Your dashboard updates instantly as transactions post. Filter by date, location, or revenue stream with a click.
Heat maps call out cost spikes and trend lines show month-over-month shifts.
“Seeing a live net margin graphic during service hours helped us adjust labor on the fly,” shares a restaurant manager.
Set alerts for when prime cost tops 60% or COGS falls under 25%. Catch anomalies—like a surprise shift in food cost—before they snowball.
Check out our guide on The Ultimate POS System for Small Restaurant Operations for more POS insights.
Best Practices And Common Pitfalls
Clear naming conventions for cost centers and GL accounts pave the way for smooth adoption. Train your team on tagging to keep entries consistent from one shift to the next.
- Standardize menu item tags before launch
- Schedule monthly audits of your export templates
- Lock settings to guard against accidental changes
- Provide a quick reference guide for staff
“Automating P&L reporting reduced our month-end close from three days to two hours,” says a Biyo POS user.
Review automated reports regularly to spot errors early. With Biyo POS handling data extraction, you’ll reclaim hours to refine menus and delight guests.
Common Questions About Restaurant Income Statements
If you’ve ever stared at a stack of sales reports and wondered how to turn them into a restaurant income statement that actually guides your strategy, you’re in good company. A clear P&L relies on precise categories for revenue, costs, and profit—nothing is more revealing than a well-organized set of line items.
Take daily sales, for example. Splitting that figure by dine-in, takeout, and delivery channels shines a light on your highest-margin opportunities. Suddenly, your monthly numbers and annual snapshots become easy to compare.
- How Do I Set Up Line Items? Separate COGS, labor, and overhead into dedicated accounts to pinpoint true expenses.
- How Do I Reconcile POS Data? Match daily sales exports to bank deposits, then factor in any voids or comps.
- What Benchmarks Should I Use? Aim for around 65% gross margin and 30% labor costs to stay competitive.
Each question here comes with a straightforward answer and practical next steps. Tweak your statement accordingly and watch small adjustments translate into bigger profits.
“Accurate P&L builds confidence in decision making every month.”
— Jordan Lee, Accountant
Choosing Reporting Frequencies
Deciding whether to run your P&L daily, weekly, or monthly really boils down to how quickly you need insights. Quick-service restaurants often lean on daily reports for tight cost control, while full-service spots might favor a monthly deep dive.
- Daily
Keep a finger on the pulse of COGS and labor in real time. - Weekly
Identify emerging trends and refine staffing or menu choices before month’s end. - Monthly
Compile a comprehensive report for partners, investors, and your own budgeting.
Match your reporting rhythm to your team’s workflow. For instance, a neighborhood pizzeria runs weekly P&Ls to fine-tune ingredient orders and minimize waste.
“Teams that match reporting with operations improve decisions by 35%, research shows.”
Ready to simplify your reporting and answer more questions about your restaurant income statement example? Get up and running in minutes with best-practice tips.
Visit our Support Center or chat with our experts today.
Biyo POS automates P&L reporting. Try Biyo POS