Point of sale reports are your business's story, told through data. They take all the raw numbers your POS system gathers—every sale, every item, every customer interaction—and turn them into a clear, actionable roadmap for growth. Instead of relying on guesswork, these reports give you the hard evidence you need to make smarter decisions.
From Transaction Data to Business Strategy
At the end of a long day, you’re probably looking at a mountain of numbers: daily sales totals, credit card slips, and inventory sheets. It’s a classic case of being data-rich but information-poor. You know what you sold, but do you know why? Can you say for sure which products are your cash cows, who your most loyal customers are, or when your peak hours really are?
This is where point of sale reports make all the difference. They’re more than just a log of what happened; they’re your strategic command center. Think of them as a real-time health check for your business, giving you a clear view and firm control over your operations.
Turning Raw Data Into Your Roadmap
Every time a customer makes a purchase, your POS system captures a valuable piece of a much larger puzzle. This raw transaction data is a key component of the big data for retail that savvy businesses use to get ahead. When your system organizes this information into clean, easy-to-read reports, you can finally see the bigger picture.
For example, you can start to:
- Boost Profitability: Pinpoint your high-margin superstars to promote and identify the slow-movers that are just gathering dust.
- Optimize Inventory: Stop tying up cash in overstocked items and avoid the frustration of running out of popular products.
- Improve Customer Experience: Recognize your regulars and create promotions that make them feel valued, ensuring they keep coming back.
By learning to read your POS data, you’re no longer just looking at a record of sales. You're looking at a powerful tool for strategic planning. It’s the crucial difference between knowing your daily revenue and understanding exactly how to grow it.
The Foundation of Smart Decisions
Ultimately, getting comfortable with your point of sale reports is the first step toward running a truly data-driven business. This guide will show you how to use these reports to get a much deeper understanding of how your business is performing. A great place to start is by understanding what kind of information your system is collecting. You can dive into the fundamentals with our detailed article on POS data and its definition. This foundational knowledge is key to turning those everyday numbers into strategies that fuel real growth.
Getting to Know Your Most Important POS Reports
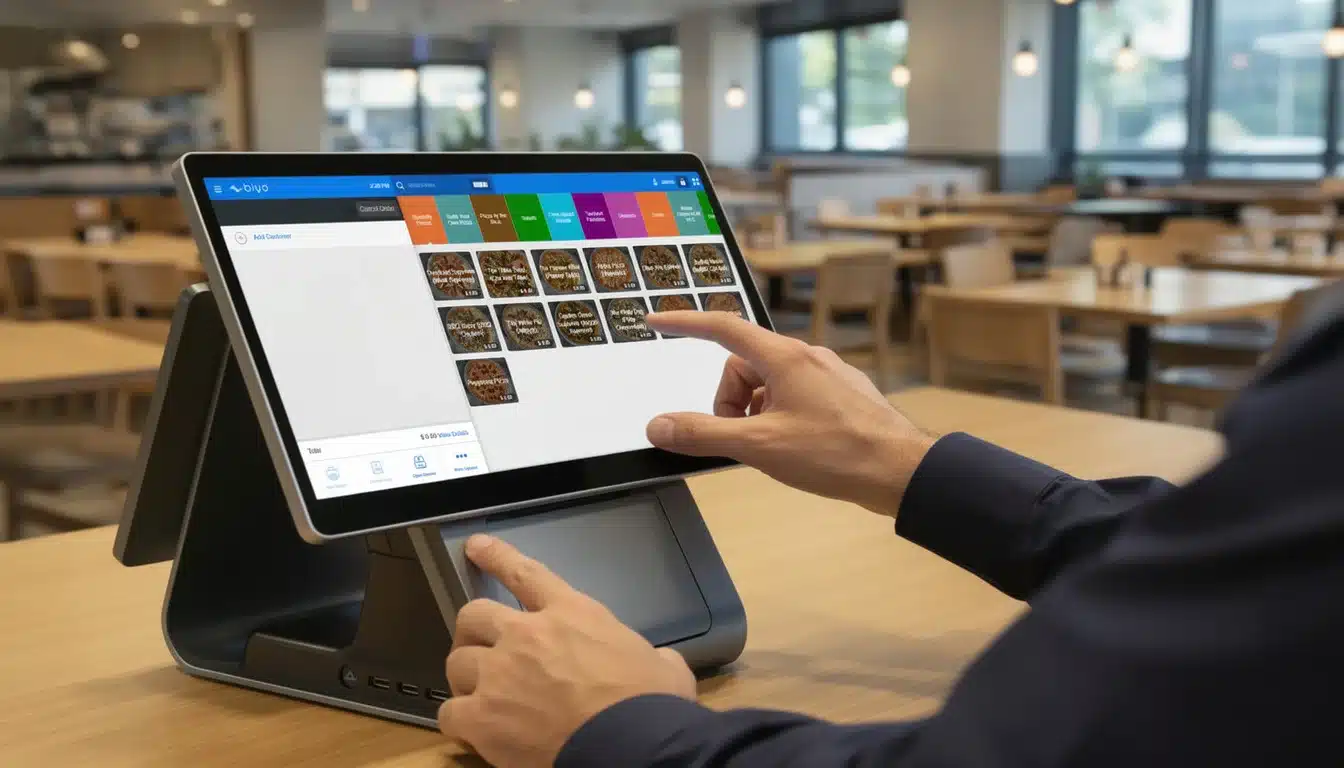
Opening up your point of sale system for the first time can feel a little intimidating. You're hit with a wall of numbers, charts, and unfamiliar terms. But don't let that fool you—those point of sale reports are your roadmap to understanding exactly what's happening inside your business. Let's cut through the noise and focus on the handful of reports that truly matter for any small or medium business owner.
Think of it this way: every single sale is a breadcrumb. By itself, it doesn't tell you much. But your POS system gathers all those breadcrumbs and bakes them into something you can actually use—clear, actionable reports that guide your business strategy.

This process isn't magic; it's just smart data organization. Raw transaction details get sorted into easy-to-read reports, which then give you the solid ground you need to make smarter decisions.
Sales Reports: Finding Your Highs and Lows
Your sales reports are the foundation of all your business insights. They do much more than just spit out a total revenue number; they give you the story behind your sales. These reports slice and dice your performance by different times of day, product categories, or even individual store locations.
With this level of detail, you can easily spot your busiest hours and staff accordingly, or figure out which products are flying off the shelves so you can give them prime placement. For anyone in the food and beverage industry, mastering these patterns is a game-changer. If you want a deeper dive, check out our guide on the top restaurant analytics metrics to skyrocket your sales.
Here’s how it works in the real world: A local café owner checks her daily sales report and notices a huge spike in iced latte sales between 2 PM and 4 PM. Armed with this insight, she launches a "Happy Hour" during that time, pairing the popular lattes with a slow-moving pastry. Just like that, a small, data-driven tweak boosts her afternoon revenue by 15%.
Inventory Reports: Your Defense Against Costly Mistakes
Poor inventory management is a quiet but deadly drain on profits. Order too much, and your cash is tied up in stock that isn't moving. Order too little, and you're left with empty shelves, frustrated customers, and lost sales. Inventory reports are your secret weapon for striking that perfect balance.
These reports give you a live look at your stock levels and track how fast different items are selling. This helps you get incredibly accurate with your demand forecasting, cutting down on waste from over-ordering and avoiding the sting of an unexpected stockout.
- Stock On-Hand Report: A simple, real-time snapshot of what you have in the building right now.
- Low Stock Alerts: Your POS will tap you on the shoulder when an item dips below a level you've set, so you can reorder before it's too late.
- Sales Velocity Report: This shows you which items are your fast-movers, helping you prioritize what to reorder most often.
Imagine you own a clothing boutique. By keeping an eye on your inventory reports, you can see which styles are becoming big hits early in the season. This allows you to place a smart reorder and ride the trend, instead of selling out in a week and missing out on all those extra sales.
Employee Performance Reports: Spotting Your All-Stars
Your team is your biggest advantage, and employee performance reports help you see their true impact. These reports track key metrics like sales per employee, average items per transaction, or even table turnover rates for a restaurant.
This isn't about playing "big brother." It's about smart management. The data helps you identify your top performers—the people who can mentor others—and spot who might need a bit more coaching. It gives you the objective information you need to build better schedules, ensuring your best salespeople are on the clock when the store is busiest.
The technology behind these reports is part of a massive, growing industry. The global market for POS terminals hit a value of $113.38 billion in 2024 and is expected to climb to $181.47 billion by 2030. With fixed terminals still making up over 58% of the market, it's clear how vital this hardware remains for day-to-day business.
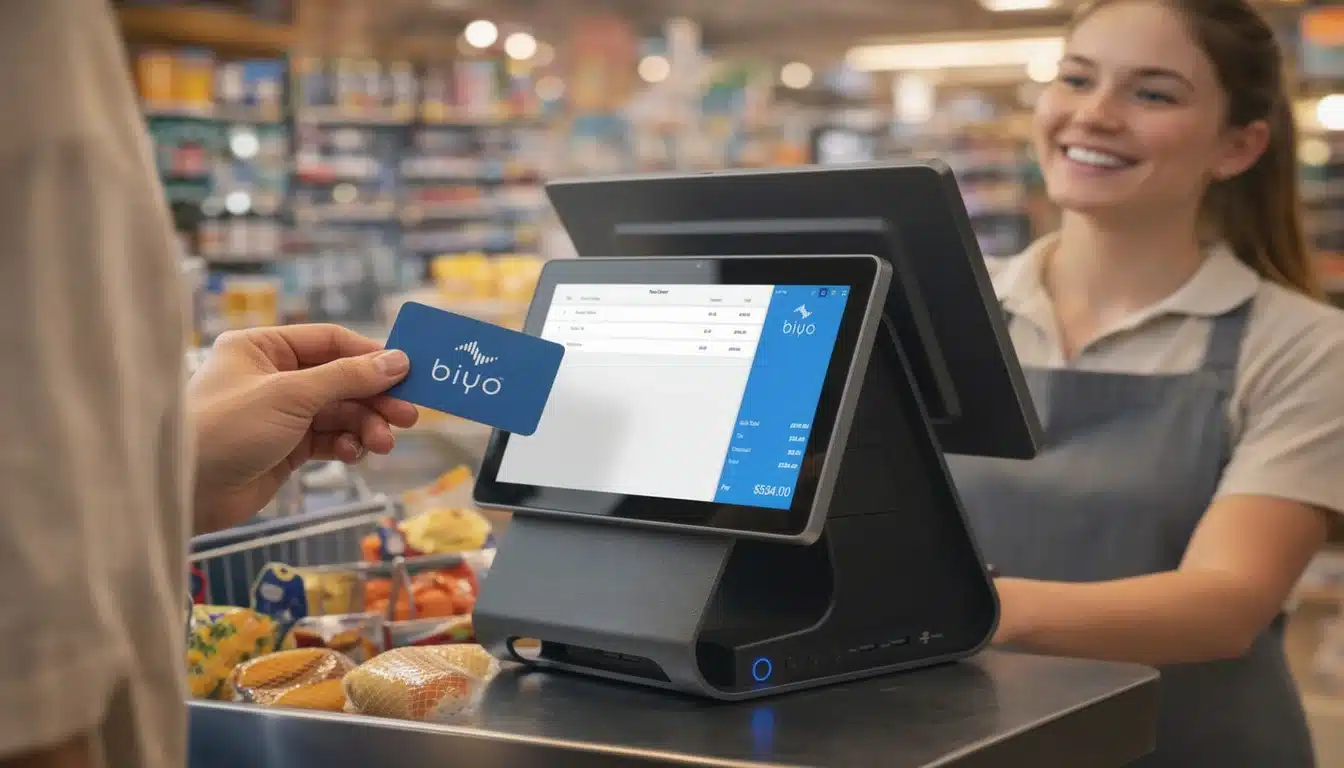
Customer Reports: The Key to Building Real Loyalty
Who are your best customers? What are their favorite products, and when do they typically shop? Customer reports hold the answers. By tracking purchase history and visit frequency, you can start to understand your customers on a much deeper level.
This information is pure gold for your marketing efforts. You can create loyalty programs that actually reward your most dedicated shoppers or send out personalized offers they'll genuinely appreciate.
For example, a small pet shop owner can pull a customer report to find everyone who regularly buys a specific brand of puppy food. When those puppies are about to turn one, the owner can send a targeted email with a discount on that same brand's adult formula. It's a small, personal touch that drives sales and makes customers feel like you truly get them.
To bring it all together, here’s a quick overview of how these essential reports translate into real business strategy.
Key Point Of Sale Reports and Their Business Applications
| Report Type | Key Metrics Included | Strategic Business Question Answered |
|---|---|---|
| Sales Report | Total Revenue, Sales by Category/Item, Sales by Time Period | "When are my busiest hours and what are my best-selling products?" |
| Inventory Report | Stock-on-Hand, Sales Velocity, Low-Stock Levels, Shrinkage | "What do I need to reorder, and which items are costing me money by sitting on the shelf?" |
| Employee Performance Report | Sales per Employee, Items per Transaction, Tip Averages | "Who are my top-performing staff members, and who might need more training?" |
| Customer Report | Purchase History, Visit Frequency, Customer Lifetime Value | "Who are my most loyal customers, and how can I encourage them to come back?" |
Ultimately, each of these reports offers a unique window into your business operations. By learning to read and act on them, you move from simply running your business to strategically growing it.
Turning Numbers Into Actionable Insights
Having a mountain of point of sale reports is a great start, but the raw numbers themselves won't grow your business. Real progress happens when you learn how to read between the lines, connect the dots, and transform those figures into a winning strategy. The true value isn't in the data itself—it's in the decisions it helps you make.
Think of your reports like ingredients for a recipe. A pile of flour, sugar, and eggs isn't a cake until you know how to combine them. In the same way, sales figures and inventory counts are just numbers until you use them to spot trends, identify what’s working (and what’s not), and uncover hidden opportunities. This is your playbook for turning those raw ingredients into a business that thrives.

Spotting Meaningful Trends and Patterns
Your data is telling a story about your customers and your operations, but you have to look for the recurring themes. One slow Tuesday might just be a fluke; four slow Tuesdays in a row is a pattern you can do something about. The trick is to compare data over time to find these valuable insights.
First, set your benchmarks. What does a "good" day look like in sales? What's your average ticket size? Once you have a baseline, it becomes much easier to see when things are heading in the right—or wrong—direction.
Keep an eye out for patterns like these:
- Time-Based Trends: Are sales always higher on weekends or during the lunch rush? This is your cue to optimize staffing, ensuring you have all hands on deck when it’s busy and can scale back when it’s quiet.
- Product Correlations: Do people who buy your signature latte also grab a croissant? This is called product affinity, and it's gold. You can use it to create combo deals or train your team to make smart upselling suggestions.
- Seasonal Shifts: Do sales for certain items spike around the holidays? Digging into last year's data helps you stock up and launch marketing campaigns for this year, so you don’t run out of a bestseller when demand is highest.
Connecting Data Across Different Reports
The most powerful discoveries often come from layering information from different reports. Looking at data in a silo gives you a narrow view, but cross-referencing reports paints a full picture of your business's health. This is where you can finally connect a specific action to a real-world result.
Let's say you ran a two-week social media campaign for a new menu item. How do you know if it actually worked? Just looking at your overall revenue won't tell you the whole story.
To prove its ROI, you'd pull a sales report for that specific item during the campaign and compare it to the two weeks before. If you see a 40% increase in sales for that item and a nice little lift in overall revenue, you’ve got concrete proof your marketing dollars were well spent.
This approach works for all sorts of scenarios. You could combine employee performance data with customer feedback to identify training gaps. If one team member consistently has lower sales and also gets negative comments, you know exactly who needs a bit more coaching.
Avoiding Common Data Interpretation Mistakes
Getting the interpretation right is just as important as collecting the data in the first place. Misreading your reports can lead you to make poor decisions that end up costing you. Watch out for these common traps.
1. Confusing Correlation with Causation
Just because two things happen at the same time doesn’t mean one caused the other. For instance, if you see ice cream sales and sunglass sales both go up in June, it’s not because buying sunglasses makes people crave a scoop. The real cause is the sunny weather. Always dig for the underlying "why" before you bet your business on a trend.
2. Ignoring the Sample Size
Making huge changes based on a tiny amount of data is a classic mistake. One customer complaint doesn't mean you should pull a product from your shelves. You need to look for patterns that show up consistently over a meaningful period before making any drastic moves.
3. Focusing Only on Positive Metrics
It’s fun to celebrate rising sales, but it's critical to see the whole picture. Are your profit margins also growing, or are your costs climbing just as fast? A holistic view that balances sales, costs, and customer satisfaction will always lead to smarter, more sustainable decisions.
Why Modern Cloud POS Reporting Is a Game Changer
If your current reporting feels clunky and disconnected, you're probably wrestling with an old-school, on-premise system. Those legacy setups trap all your data on a single machine, basically chaining you to the back office computer. A modern cloud POS system completely flips that script. It transforms your point of sale reports from static documents into a living, breathing command center you can access from anywhere.
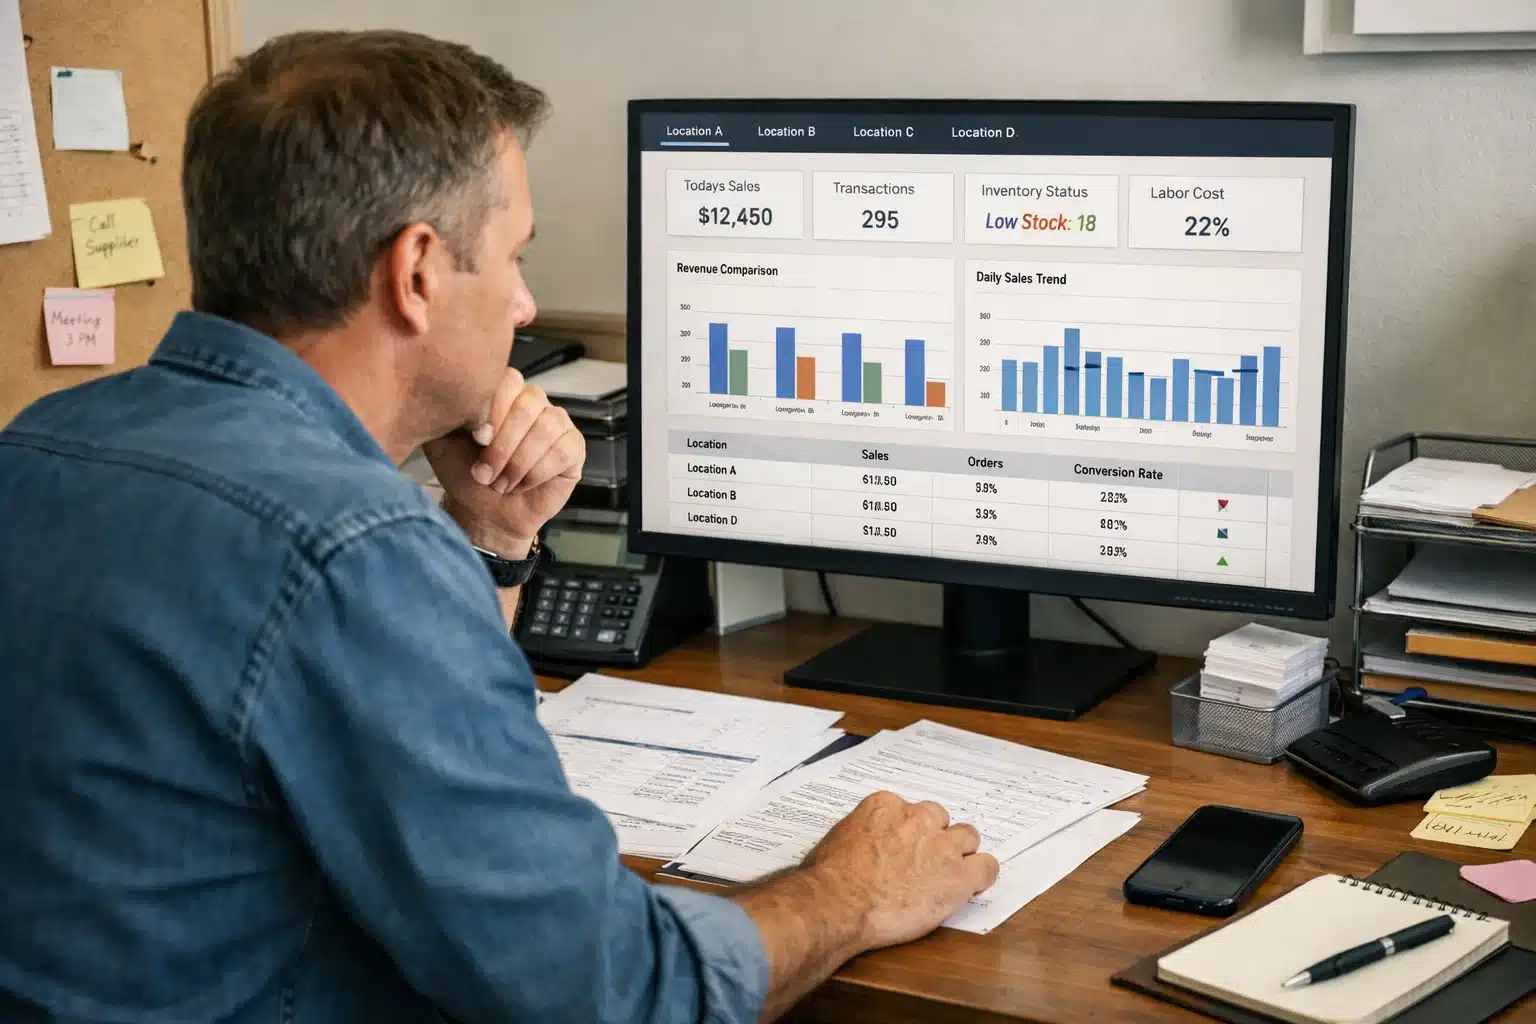
This isn't just a simple tech upgrade—it's a fundamental change in how you run your business. Imagine tweaking happy hour prices from your phone while you're out running errands. Or picture checking sales across three different locations from one dashboard on your tablet. That's the freedom and power a cloud-based approach gives you.
Real-Time Data Access From Anywhere
The single biggest win with cloud-based point of sale reports is getting instant access to your data, no matter where you are. Traditional systems force you to be physically on-site to pull numbers, making it impossible to make quick, smart decisions. With the cloud, your sales, inventory, and staff data are synced and live on any device with an internet connection.
This immediate access means you can finally:
- Monitor performance remotely: Keep tabs on sales trends and jump on problems without having to race back to the store.
- Make on-the-fly adjustments: Spot a sudden dinner rush and instantly launch a flash sale or adjust staff schedules to handle it.
- Empower your managers: Give your team the data they need to make good calls without having to wait for you to run an end-of-day report.
The ability to see exactly what’s happening in your business, the moment it happens, transforms you from a reactive manager into a proactive strategist. It’s like having a live dashboard of your business’s health right in your pocket.
Seamless Integration and Automation
Today's businesses run on a whole suite of tools, from accounting software to e-commerce platforms. A huge headache with older POS systems is that they don't talk to these other essential apps. This creates frustrating data silos and forces you into hours of mind-numbing manual entry.
Cloud POS systems, on the other hand, are built to connect. They integrate smoothly with your other software, creating a unified ecosystem where information flows automatically. For instance, your daily sales can sync directly with your accounting software, saving you hours of reconciliation and cutting down on human error. In the same way, an online sale from your website can instantly update your physical store’s inventory, preventing you from selling an item you no longer have. To get a better handle on how this all works, you can learn more about what a cloud-based POS system is and see how it centralizes your business.
Scalability and Future-Proofing Your Business
As your business grows, your needs change. Opening a new location, launching a webstore, or just adding new products can push a legacy POS to its breaking point. Cloud-based solutions are built to grow with you, plain and simple. Adding a new register or even a whole new store is often as easy as logging into your account and making a few clicks.
This natural scalability is a big reason they've taken over. Cloud-based systems are the new standard, with projections showing more than 72% of retailers worldwide will be using them by 2025. This trend is part of a market valued at $4.70 billion in 2023 that continues to climb, proving that businesses are choosing flexibility. If you're interested in the numbers, you can discover more insights about the retail POS market. By choosing a cloud POS, you’re not just solving today’s problems—you’re setting your business up on a platform that can support your future ambitions.
Getting the Most Out of Your POS Reports
To really tap into what your point of sale reports can do, you need a system. Any modern POS can collect data, but the real magic happens when you weave that information into your daily, weekly, and monthly routines. Building a few key habits turns reporting from a chore into your secret weapon for making smarter business decisions.
Think of it like checking the gauges on your car. You wouldn't drive cross-country without glancing at your fuel level or engine temperature, right? In the same way, you shouldn't run your business without regularly checking its vital signs. These best practices are your checklist for making data a core part of how you operate.
Set a Consistent Review Schedule
Data gets stale fast. If you're not looking at it consistently, you're missing the story. Setting a regular time to check your reports ensures you catch small issues before they snowball and spot opportunities as they pop up. A simple, structured schedule is the first step toward building a data-savvy culture.
- Daily Check-In (5 minutes): This is your quick health check. Pull up the end-of-day sales summary, look at your cash flow, and scan for any unusual voids or discounts. It’s a simple habit that guarantees financial accuracy and helps you spot anything fishy right away.
- Weekly Huddle (30 minutes): Time to go a bit deeper. Dig into your sales trends, see what’s flying off the shelves versus what’s collecting dust, and review employee performance. This is the perfect time to make small adjustments, like tweaking next week's staff schedule or creating a flash sale for that overstocked product.
- Monthly Strategy Session (1 hour): This is where you look at the big picture. Review your profit and loss, compare this month's numbers to last month's and last year's, and see how that big marketing push actually performed. Use these insights to set clear, realistic goals for the month ahead.
Customize Your Dashboard for What Matters
Most modern POS systems let you customize your dashboard, but a surprising number of owners just stick with the factory settings. That's a huge missed opportunity. Your dashboard should be your business’s command center, showing you the Key Performance Indicators (KPIs) that truly matter for your goals.
If you’re trying to boost customer loyalty, your dashboard should have customer return rate and average spend per visit front and center. If you’re laser-focused on efficiency, you’ll want to prioritize metrics like your inventory turnover rate and sales per labor hour.
Why it matters: A custom dashboard cuts through the noise. When your most critical metrics are right there every time you log in, you can get a gut check on your business in seconds and stay focused on what will actually move the needle.
Get Your Team Involved with the Data
Your employees are on the front lines every single day. They're talking to customers and handling products. When you give them access to the right data, they can make smarter decisions in the moment—decisions that directly help the business. Don’t keep your point of sale reports locked away in the back office.
Instead, share relevant insights to give your team a real sense of ownership. It’s easier than you think.
- Share Top-Seller Info: Let your staff know which items are the most popular and, more importantly, the most profitable. This helps them make better recommendations. For example, knowing a particular side dish has a high-profit margin will encourage your servers to suggest it more often.
- Highlight Performance Metrics: Use employee reports to celebrate wins and find coaching moments. You can even start friendly competitions around metrics like average transaction value or items per sale to motivate everyone to bring their A-game.
- Use Data to Solve Problems: Did the inventory report show you’re always running out of a popular item? Bring it up with the team. They might have on-the-ground insights—like noticing customers are asking for it more after a local event—that will help you perfect your ordering strategy.
From Struggling to Thriving: A Data-Driven Case Study
Let’s move from theory to reality with the story of "The Rolling Scone," a bakery with a few different locations. The owner, Clara, felt like she was flying blind. Inventory was a mess across her three shops, profit margins were a total mystery, and staff schedules were based more on guesswork than actual customer traffic. Her business was surviving, but it definitely wasn't thriving.
Clara decided it was time to stop guessing and start digging into her point of sale reports. Her journey is a perfect example of how just a few key reports can completely turn a business around, swapping confusion for clarity and control.
Solving the Profitability Puzzle
Clara's first big question was a simple one: which products were actually making her money? The bakery’s artisan sourdough loaves were famous, but the detailed baking process was expensive. Were they really profitable, or were the simple chocolate chip cookies the real moneymakers?
She pulled a product profitability report, which lined up sales data right next to ingredient costs. The results were a shock. While the sourdough sold well, its profit margin was razor-thin at just 15%. On the other hand, the humble chocolate chip cookies had a massive 65% margin. This single insight led her to slightly increase the price of the sourdough and create a promotional bundle pairing it with high-margin coffee. Just like that, her bottom line improved.
Taming the Inventory Beast
Next up, Clara decided to tackle waste. One week, she’d have to toss out stale croissants; the next, she’d sell out of muffins by 10 AM, frustrating her regulars. It felt like a constant, frustrating cycle of having too much or not enough.
To fix this, she dove into her inventory velocity report. This report showed her exactly how quickly each item was selling at each specific location. She quickly saw that her downtown shop sold twice as many breakfast pastries as her suburban one, which sold more whole loaves for families. Armed with this granular data, she tailored her daily baking plans for each location. The result? She cut food waste by over 30% and nearly eliminated stockouts of her most popular items.
By looking at sales and inventory data together, Clara stopped making generic decisions for her entire business and started making precise, location-specific choices that saved money and boosted sales.
Optimizing Staff for Peak Performance
Finally, Clara knew she had to fix her inefficient staff scheduling. It felt like she was either overstaffed during quiet periods or completely swamped during rushes. The answer was waiting for her in the sales by hour report, which clearly mapped out the peaks and valleys of customer traffic.
The data showed a predictable morning rush from 7:30 to 9:00 AM and a surprisingly busy afternoon spike from 3:00 to 4:30 PM. Clara completely redesigned her schedule around these data points, making sure she had an extra baker and barista on hand during those peak times. This simple change dramatically reduced customer wait times, improved employee morale, and led to a 10% increase in overall daily sales.
This kind of transformation highlights just how essential modern POS systems have become. The global point-of-sale market hit $33.41 billion in 2024, with major players leading the way by giving businesses like Clara's these powerful analytical tools. You can read the full research about these POS statistics to get a better sense of the market's rapid growth.
Answering Your Top Questions About POS Reports
Even with the best game plan, you're bound to have questions as you start digging into your sales data. Let's tackle some of the most common ones that pop up for business owners, so you can feel ready to put your reports to work.
How Often Should I Check My Reports?
The key here is consistency. Think of it like a regular health check for your business—you wouldn’t wait a year to see how things are going.
Here’s a simple rhythm that works for most businesses:
- Daily: Take a quick glance at your sales summary. This helps you keep a finger on the pulse of your cash flow and catch any red flags right away.
- Weekly: Go a little deeper. This is the perfect time to look at sales trends, see which items are flying off the shelves, and check on your inventory levels.
- Monthly: Zoom out for the big picture. Use this review to see if your bigger strategies are paying off, like that new marketing campaign or your overall profitability goals.
Which Reports Are Most Important for a New Business?
When you're just starting out, it's easy to get overwhelmed by all the data. My advice? Keep it simple. Focus on just a few core point of sale reports that give you the most critical information for running your day-to-day operations.
If you're new to this, start with these four: a Sales Summary to track your money, a Best-Sellers Report to know what's popular, an Inventory On-Hand Report to manage stock, and an Employee Sales Report to see who your top performers are. Nail these, and you'll have a solid foundation for making smart decisions.
Can I Really Use These Reports for Marketing?
Absolutely! Your POS data is a goldmine for smarter marketing. For instance, you can run a sales report during a promotion to see exactly how much revenue it generated, giving you a clear return on your investment.
Beyond that, customer reports can show you who your most loyal shoppers are. With that knowledge, you can create special offers or loyalty programs just for them. It’s a fantastic way to make your best customers feel appreciated, which keeps them coming back and turning them into advocates for your brand.
Ready to turn your business data into your greatest asset? Biyo POS provides the intuitive, powerful reporting tools you need to make smarter decisions, optimize your operations, and drive real growth. Start your free 14-day trial today!